Part 5 of 6 (e) Find the equation of the regression line and draw the line on the scatter plot. Round the slope and y-intercept to at least four decimal plac The equation of the regression line is y =
Part 5 of 6 (e) Find the equation of the regression line and draw the line on the scatter plot. Round the slope and y-intercept to at least four decimal plac The equation of the regression line is y =

Glencoe Algebra 1, Student Edition, 9780079039897, 0079039898, 2018
18th Edition
ISBN:9780079039897
Author:Carter
Publisher:Carter
Chapter10: Statistics
Section10.5: Comparing Sets Of Data
Problem 14PPS

Related questions

Question
Just need help with part 5, thank you!
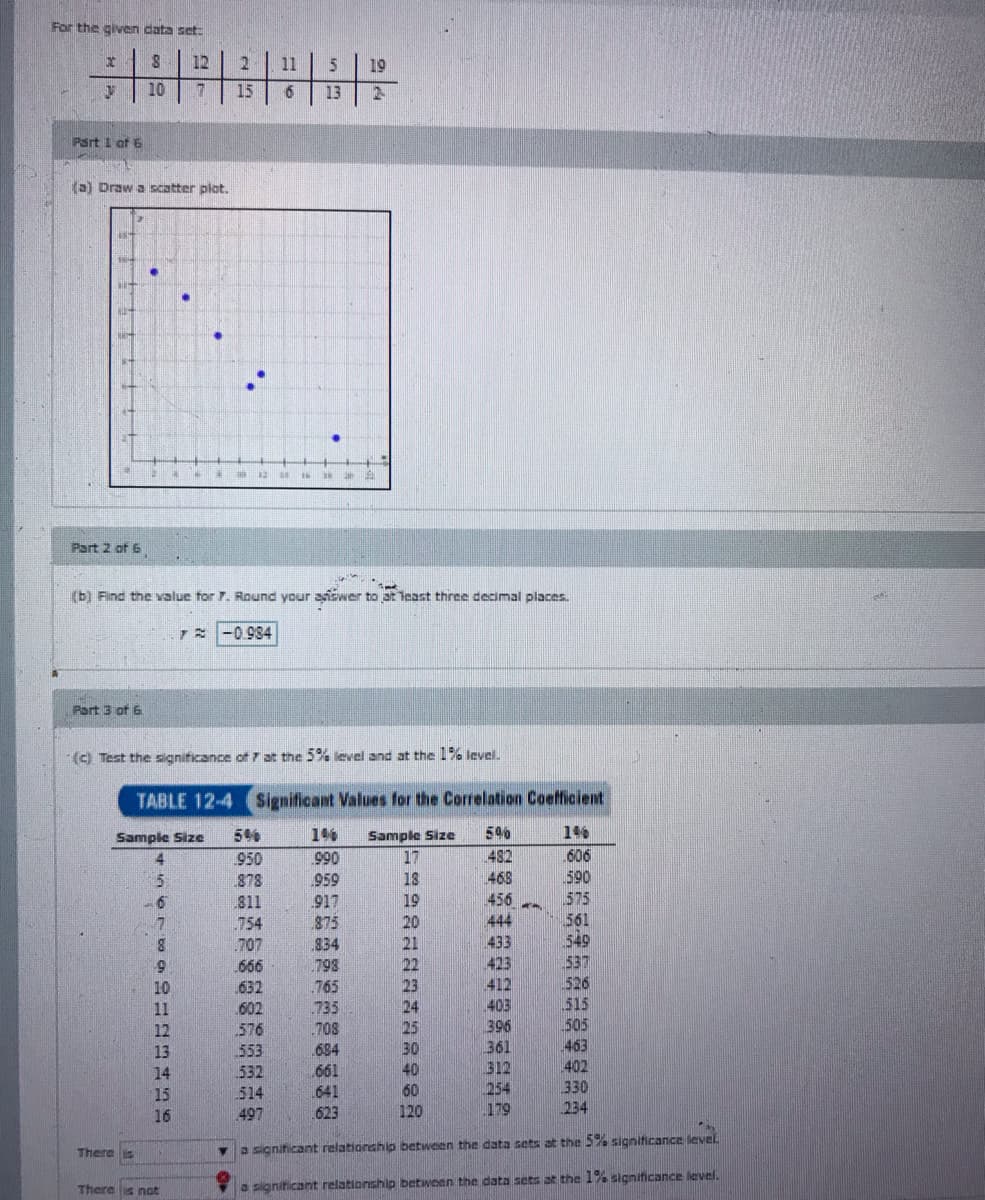
Transcribed Image Text:For the given data set.
12
11
19
10
15
13
Part 1 of 6
2) Draw a scatter plot.
Part 2 of 6
(b) Find the value for 7. Round your ansvwer to at least three decimal places.
7E -0.984
Port 3 of 6
(c) Test the significance of 7 at the 5% level and at the 1% level.
TABLE 12-4 Significant Values for the Correlation Coefficient
146
5%
146
Sample Size
17
Sample Size
482
606
590
950
990
878
959
18
468
456
444
575
19
20
21
811
917
875
561
549
537
526
515
505
463
402
7
.754
433
707
666
834
423
22
23
6.
798
412
403
396
361
10
632
.765
11
602
735
24
12
576
708
25
30
684
661
13
553
40
312
254
14
532
15
514
641
60
330
16
497
623
120
179
234
There s
a significant relationahip between the data sets at the 5% significance level.
There s not
a signiticant relationship between the data sets at the 1% significance level.
Transcribed Image Text:6.
.666
798
22
423
537
10
.632
.765
23
412
526
11
.602
735
24
403
515
12
576
708
25
396
505
13
553
684
30
361
463
14
.532
.661
40
312
402
15
514
.641
60
254
330
16
497
.623
120
179
234
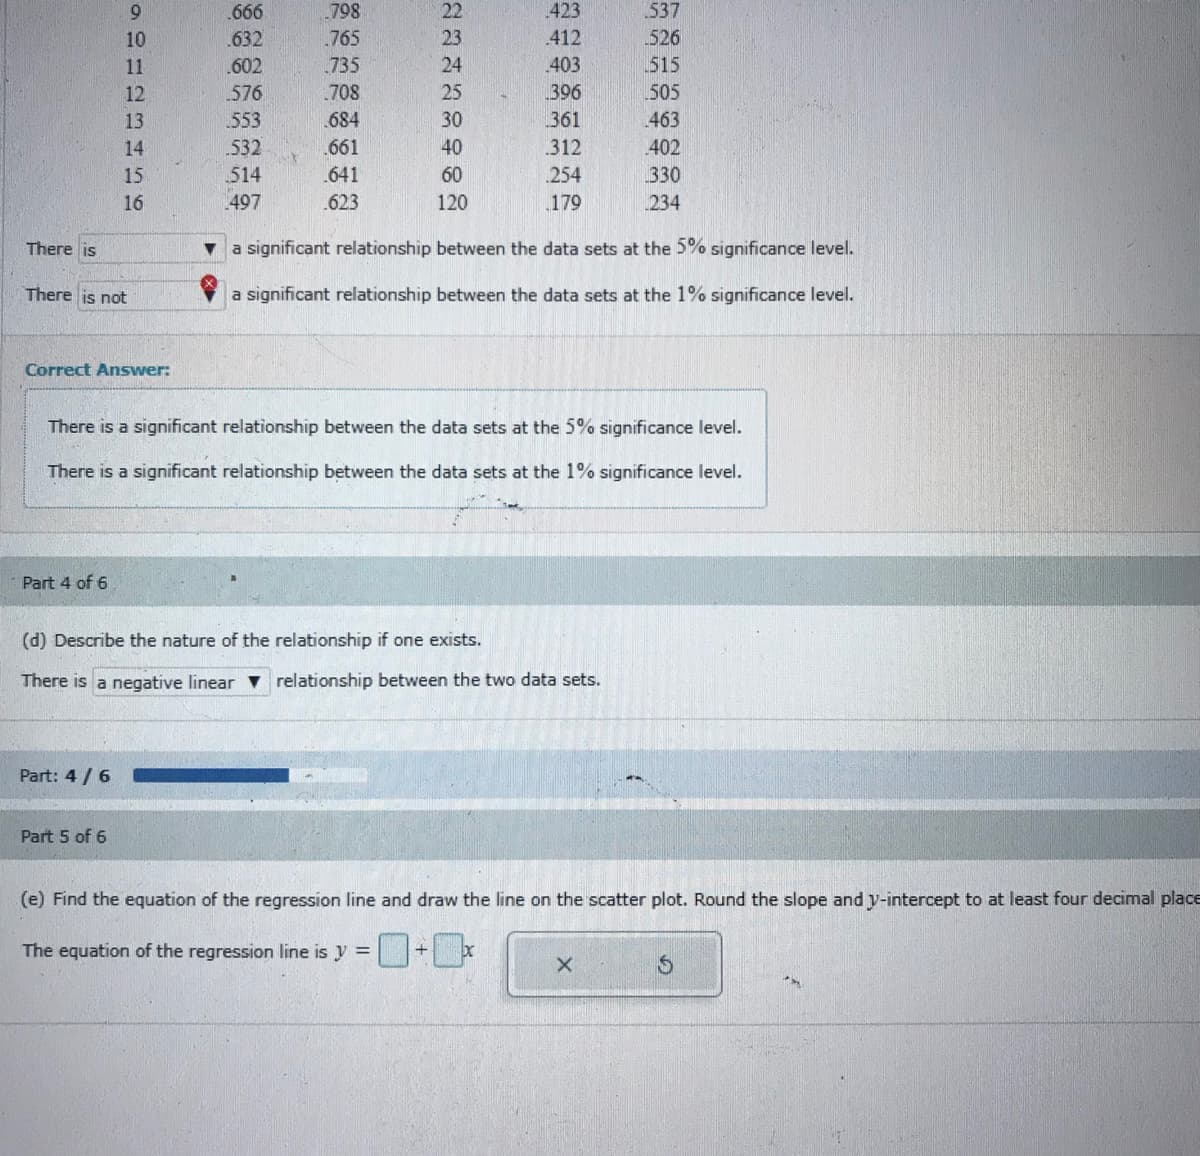
There is
a significant relationship between the data sets at the 5% significance level.
There is not
a significant relationship between the data sets at the 1% significance level.
Correct Answer:
There is a significant relationship between the data sets at the 5% significance level.
There is a significant relationship between the data sets at the 1% significance level.
Part 4 of 6
(d) Describe the nature of the relationship if one exists.
There is a negative linear v relationship between the two data sets.
Part: 4 /6
Part 5 of 6
(e) Find the equation of the regression line and draw the line on the scatter plot. Round the slope and y-intercept to at least four decimal place
The equation of the regression line is y =
Expert Solution
This question has been solved!
Explore an expertly crafted, step-by-step solution for a thorough understanding of key concepts.

Step by step
Solved in 2 steps with 1 images

Knowledge Booster


Learn more about
Need a deep-dive on the concept behind this application? Look no further. Learn more about this topic, statistics and related others by exploring similar questions and additional content below.Recommended textbooks for you
Glencoe Algebra 1, Student Edition, 9780079039897…
Algebra
ISBN:
9780079039897
Author:
Carter
Publisher:
McGraw Hill
Glencoe Algebra 1, Student Edition, 9780079039897…
Algebra
ISBN:
9780079039897
Author:
Carter
Publisher:
McGraw Hill