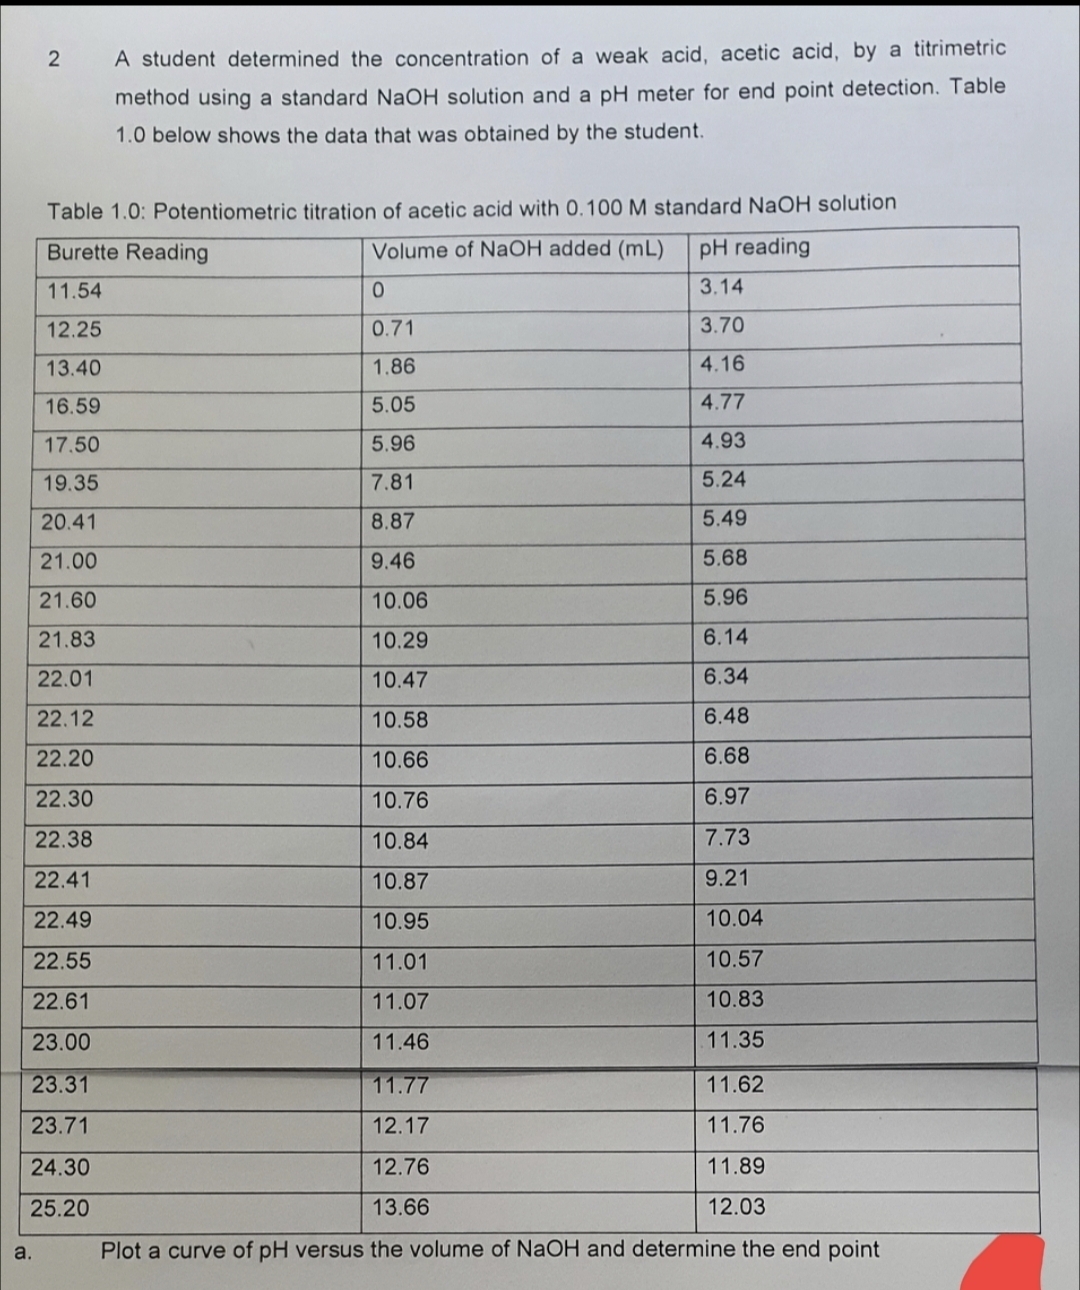
2 A student determined the concentration of a weak acid, acetic acid, by a titrimetric method using a standard NaOH solution and a pH meter for end point detection. Table 1.0 below shows the data that was obtained by the student. Table 1.0: Potentiometric titration of acetic acid with 0.100 M standard NaOH solution Burette Reading Volume of NaOH added (mL) pH reading 11.54 0 3.14 12.25 0.71 3.70 13.40 1.86 4.16 16.59 5.05 4.77 17.50 5.96 4.93 19.35 7.81 5.24 20.41 8.87 5.49 21.00 9.46 5.68 21.60 10.06 5.96 21.83 10.29 6.14 22.01 10.47 6.34 22.12 10.58 6.48 22.20 10.66 6.68 22.30 10.76 6.97 22.38 10.84 7.73 22.41 10.87 9.21 22.49 10.95 10.04 22.55 11.01 10.57 22.61 11.07 10.83 23.00 11.46 11.35 23.31 11.77 11.62 23.71 12.17 11.76 24.30 12.76 11.89 25.20 13.66 12.03 Plot a curve of pH versus the volume of NaOH and determine the end point a.
2 A student determined the concentration of a weak acid, acetic acid, by a titrimetric method using a standard NaOH solution and a pH meter for end point detection. Table 1.0 below shows the data that was obtained by the student. Table 1.0: Potentiometric titration of acetic acid with 0.100 M standard NaOH solution Burette Reading Volume of NaOH added (mL) pH reading 11.54 0 3.14 12.25 0.71 3.70 13.40 1.86 4.16 16.59 5.05 4.77 17.50 5.96 4.93 19.35 7.81 5.24 20.41 8.87 5.49 21.00 9.46 5.68 21.60 10.06 5.96 21.83 10.29 6.14 22.01 10.47 6.34 22.12 10.58 6.48 22.20 10.66 6.68 22.30 10.76 6.97 22.38 10.84 7.73 22.41 10.87 9.21 22.49 10.95 10.04 22.55 11.01 10.57 22.61 11.07 10.83 23.00 11.46 11.35 23.31 11.77 11.62 23.71 12.17 11.76 24.30 12.76 11.89 25.20 13.66 12.03 Plot a curve of pH versus the volume of NaOH and determine the end point a.

Chapter15: Complex Acid/base Systems
Section: Chapter Questions
Problem 15.26QAP

Related questions

Question
Transcribed Image Text:2
A student determined the concentration of a weak acid, acetic acid, by a titrimetric
method using a standard NaOH solution and a pH meter for end point detection. Table
1.0 below shows the data that was obtained by the student.
Table 1.0: Potentiometric titration of acetic acid with 0.100 M standard NaOH solution
Burette Reading
Volume of NaOH added (mL)
pH reading
11.54
0
3.14
12.25
0.71
3.70
13.40
1.86
4.16
16.59
5.05
4.77
17.50
5.96
4.93
19.35
7.81
5.24
20.41
8.87
5.49
21.00
9.46
5.68
21.60
10.06
5.96
21.83
10.29
6.14
22.01
10.47
6.34
22.12
10.58
6.48
22.20
10.66
6.68
22.30
10.76
6.97
22.38
10.84
7.73
22.41
10.87
9.21
22.49
10.95
10.04
22.55
11.01
10.57
22.61
11.07
10.83
23.00
11.46
11.35
23.31
11.77
11.62
23.71
12.17
11.76
24.30
12.76
11.89
25.20
13.66
12.03
Plot a curve of pH versus the volume of NaOH and determine the end point
a.
Expert Solution
This question has been solved!
Explore an expertly crafted, step-by-step solution for a thorough understanding of key concepts.

Step by step
Solved in 2 steps with 5 images

Knowledge Booster


Learn more about
Need a deep-dive on the concept behind this application? Look no further. Learn more about this topic, chemistry and related others by exploring similar questions and additional content below.Recommended textbooks for you

Chemistry: Principles and Practice
Chemistry
ISBN:
9780534420123
Author:
Daniel L. Reger, Scott R. Goode, David W. Ball, Edward Mercer
Publisher:
Cengage Learning
Chemistry: Principles and Practice
Chemistry
ISBN:
9780534420123
Author:
Daniel L. Reger, Scott R. Goode, David W. Ball, Edward Mercer
Publisher:
Cengage Learning

Chemistry: Principles and Reactions
Chemistry
ISBN:
9781305079373
Author:
William L. Masterton, Cecile N. Hurley
Publisher:
Cengage Learning