Exhibit 1 Stem-and-leaf of Data: Amount of Money earned in a day in dollars Leaf Unit 10 N = 59 3 234 13 3 55779999 (**) 4 0001233 14 4 5569 *** 03344 7788 1 6. 1 What is the range of the distribution? What are the values of *, (i) ** and ***? (ii) (iii) (iv) (v) What is the median of the distribution? Use the stem-and-leaf diagram above to draw a box-and-whisker diagram. Comment on the skewness of the distribution. LO
Q: A distribution has a standard deviation of σ = 10 . Find the z-score for each of the following…
A: Hi! Thank you for the question, As per the honor code, we are allowed to answer three sub-parts at a…
Q: True or False: The Chi-square distribution is normally distributed
A: Chi Square distribution : The square of the standard normal variate is known as a Chi square variate…
Q: Consider the followving frequency distribution. Class Frequency 10-19 10 20-29…
A: In grouped data, observations are clustered into groups. The grouped data included the groups and…
Q: 1. A patient is classified as having gestational diabetes if their glucose level is above 140…
A: Given Data: Mean=149 SD=10 Let X be the random variable X~ Normal Distribution (149, 10^2)
Q: The accompanying data or 45 commute times to work in a minute for workers 16 or older in Chicago…
A: Arrange the given numbers in ascending order. 4, 10, 10, 12, 12, 15, 15, 15, 15, 15, 15, 20, 20, 20,…
Q: The data represents the body mass index (BMI) values for 20 females. Construct a frequency…
A: We have given that the data represents the body mass index (BMI) values for 20 females.
Q: The following shows the frequency distribution of age of a random sample of 50 patients.:- Class…
A:
Q: Compute the standard scores for the batting averages of Cobb, Williams, and Brett to compare how far…
A: Given: Decade Mean sd Sample mean 1910 0.266 0.0371 0.42 1940 0.267 0.0326 0.406 1970…
Q: 3. The frequenty distribution below shows the daily allowance of 200 students. Allowance (Php)…
A: Class Frequency 200 - 239 9 240 - 279 14 280 - 319 19 320 - 359 32 360 - 399 43 400…
Q: Q4: The manager of a convenience store records the number of gallons of gasoline purchased for a…
A: It is given that the lower limit of first class is 0 and there are 5 classes, each of width 4. Then,…
Q: The General Social Survey collects data on demographics, education, and work, among many other…
A:
Q: Construct the cumulative frequency distribution for the given data. Cumulative Daily Low Temperature…
A: we have to construct cummulative frequency distribution for the given data.
Q: Construct the cumulative frequency distribution for the given data. Age (years) of Best Actress…
A: Given Age (years) of Best Actress when award was won Frequency 20-29 29 30-39…
Q: The marital status distribution of the U.S. male population, age 15 and older, is as shown below.…
A: The expected frequency is n ×pi
Q: ) The amount of money earned in a day by Ms. Anne’s craft shop was recorded and displayed in the…
A: i) From the given information, the leaf unit is 10. Therefore, the data values are, 250, 290, 320,…
Q: Suppose the following are the ages of a group of individuals enrolled in a study looking at the…
A: Given information: The data represents the ages of a group of individuals enrolled in a study…
Q: m oand-whisker plot shows the distribution for three-star hotel rates per night in New York City.…
A:
Q: Suppose that the distance of fly balls hit to the outfield (in baseball) is normally distributed…
A:
Q: Consider the frequency distribution shown to the right. Class 0< 10 10 < 20 20<30 30 < 40 40< 50…
A: a. From the given information, Class Frequency Relative frequency=(frequency/total…
Q: The graph illustrates a normal distribution for the prices paid for a particular model of HD…
A:
Q: a) What is meant by dispersion. Explain the difference between absolute dispersion and relative…
A: a) Dispersion can be defined as the extent to which a numerical data is likely to get dispersed or…
Q: Isle Royale, an island in Lake Superior, has provided an important study site of wolves and their…
A:
Q: The graph illustrates a normal distribution for the prices paid for a particular model of HD…
A: We have given that X~N(mu,sigma^2) mu=1000,sigma =50 Z-socre =(x-mu)/sigma Note:- According to…
Q: Emissions of nitrogen oxides, which are major constituents of smog, can be modeled using a normal…
A: From the provided information, Mean (µ) = 1.5 Standard deviation (σ) = 0.4 Let X be a random…
Q: the mean x and standard deviation s measure center and variability but are not a complete…
A: Obtain mean of the dataset a.The data points of the dataset a are:a: 9.14, 8.14, 8.74, 8.77, 9.26,…
Q: The accompanying table shows the tax, in dollars, on a pack of cigarettes in 30 randomly selected…
A: Hii ! Thanks for posting the question . Since your question has more than three subparts , we have…
Q: A distribution has a standard deviation of σ = 10 . Find the z -score for each of the following…
A: The Z score in statistics is defined in terms of population mean and standard deviation. The…
Q: The data represents the daily rainfall (in inches) for one month. Construct a frequency distribution…
A: Arrange the data values from smallest from largest. Count the number of values fall in each…
Q: The data represents the body mass index (BMI) values for 20 females. Construct a frequency…
A: The lower-class limits is 15 and the class width is 6.
Q: The frequency distribution given below is constructed from the ages of 200 people of 40 years old or…
A: Relative Frequency=R Frequency=F Total Frequency=T=200 Relative Frequency=(Frequency/Total…
Q: The graph illustrates a normal distribution for the prices paid for a particular model of HD…
A: Since we only answer up to 3 sub-parts, we’ll answer the first 3. Please resubmit the question and…
Q: We are given the incomplete relative frequency distribution. Outcome 4 Rel. Frequency 0.3 0.2 0.1…
A: Let the missing relative frequency is x,
Q: The data represents the body mass index (BMI) values for 20 females. Construct a frequency…
A: Frequency distribution: To carry the data analysis the given original data should be grouped in…
Q: Emissions of nitrogen oxides, which are the major constituents of smog, can be modeled using a…
A: It is given that the mean is 1.6 and the standard deviation is 0.4.
Q: The marital status distribution of the U.S. male population, age 15 and older, is as shown below.…
A: The expected frequencies are, Marital Status Frequency Percent Expected frequency Never married…
Q: The data given below represent the percentage of energy derived from coal from the 50 states plus…
A:
Q: The undergraduate grade point averages (UGPA) of students taking an admissions test in a recent year…
A: The mean is 3.26 and the standard deviation is 0.15.
Q: The table below shows relative frequency distribution for 50 employees working in a small…
A:
Q: 3. Table below shows the data collected on a rural highway during a speed study. Develop the…
A: X=Speed of car Max speed=65.0 km/h Min speed=34.8 km/h For 16 classes, the range per class is 1.9…
Q: The graph illustrates a normal distribution for the prices paid for a particular model of HD…
A: Hey, since there are multiple subparts posted, we will answer first three question. If you want any…
Q: The marital status distribution of the U.S. male population, age 15 and older, is as shown below.…
A: The null and alternative hypotheses are stated below: H0: The age group of males fits the…
Q: Real estate market cycles are commonly divided into four phases, Recovery (1), Expansion (II),…
A: The ranks for the four phases is given below: I Rank 1 II Rank 2 III Rank 3 IV Rank 4 -1.7 3.5…
Q: The undergraduate grade point averages (UGPA) of students taking an admissions test in a recent year…
A: Given: μ=3.28 and σ=0.19 To find minimum UGPA that would still place a student in the top 5% of…
Q: Your second assignment is to organize the same set of data you used in Assignment 1 for this week…
A: We have given the data. We first find out the frequency by counting repeated numbers. The relative…
Q: The accompanying data are 45 commute times to work in minutes for workers of age 16 or older in…
A: The accompanying data are 45 commute times to wort, in minutes for workers of age 16 or older in…
Q: The table below shows the frequency distribution for the ages of women who became mothers during one…
A: The given data set is:
Q: The relative frequency table below shows the waiting time, to the nearest minutes, of patients at…
A: Introduction: For a grouped data with k classes with the ith class having class mark xi and class…
Q: The following table shows a data set containing information for 25 of the shadow stocks tracked by…
A: 1. The frequency distribution of the Gross profit margin for the given class intervals is as follows…
Q: The graph illustrates a normal distribution for the prices paid for a particular model of HD…
A:
Q: The data represents the body mass index (BMI) values for 20 females. Construct a frequency…
A: BMI Sort data 17.7 17.7 33.5 18.3 26.3 19.2 25.7 21.3 21.3 22.7 27.4 23.4 24.8 24.6…
The amount of money earned in a day by Ms. Anne’s craft shop was recorded and displayed in the stem-and-leaf diagram shown below in Exhibit 1.
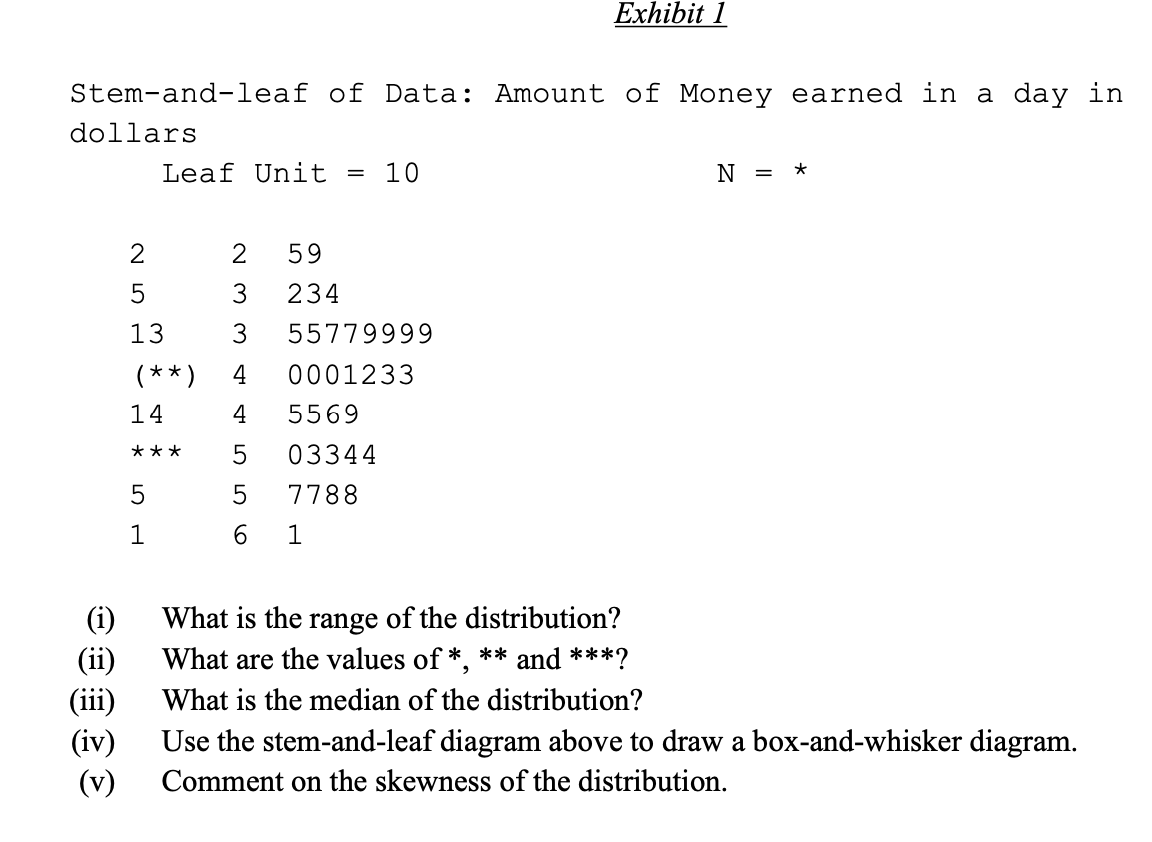
Step by step
Solved in 4 steps
- The graph illustrates a normal distribution for the prices paid for a particular model of HD television. The mean price paid is $2000 and the standard deviation is $75.1775185019252000207521502225Distribution of Prices[Graphs generated by this script: setBorder(10,30,10,5);initPicture(-3.5,3.5,-.1,.45);line([-78.5,0],[78.5,0]);line([-3,.02],[-3,-.02]);text([-3,-.01],"1775","below");line([-2,.02],[-2,-.02]);text([-2,-.01],"1850","below");line([-1,.02],[-1,-.02]);text([-1,-.01],"1925","below");line([0,.02],[0,-.02]);text([0,-.01],"2000","below");line([1,.02],[1,-.02]);text([1,-.01],"2075","below");line([2,.02],[2,-.02]);text([2,-.01],"2150","below");line([3,.02],[3,-.02]);text([3,-.01],"2225","below");textabs([200,0],'Distribution of…The control department of a light bulb manufacturer randomly picks 4400 light bulbs from the production lot every week. The records show that, when there is no malfunction, the defect rate in the manufacturing process (due to imperfections in the material used) is 1%. When 1.25% or more of the light bulbs in the sample of 4400 are defective, the control unit calls repair technicians for service. a)Find the mean of p, where p is the proportion of defective light bulbs in a sample of 4400 when there is no malfunction. b)Find the standard deviation of p. c)Compute an approximation for P≥p0.0125, which is the probability that the service technicians will be called even though the system is functioning properly. Round your answer to four decimal places.Use the central limit theorem to find the mean and standard error of the mean of the indicated sampling distribution. Then sketch a graph of the sampling distribution. The per capita consumption of red meat by people in a country in a recent year was normally distributed, with a mean of 116 pounds and a standard deviation of 38.3. pounds. Random samples of size 20 are drawn from this population and the mean of each sample is determined. μx=____
- How likely it is that a mean from a particular sample is representative of the population is defined as: t-score F-statistic z-score p-valueUse the central limit theorem to find the mean and standard error of the mean of the indicated sampling distribution. Then sketch a graph of the sampling distribution. The per capita consumption of red meat by people in a country in a recent year was normally distributed, with a mean of 113 pounds and a standard deviation of 37.7 pounds. Random samples of size 20 are drawn from this population and the mean of each sample is determined.Use the central limit theorem to find the mean and standard error of the mean of the indicated sampling distribution. Then sketch a graph of the sampling distribution. The per capita consumption of red meat by people in a country in a recent year was normally distributed, with a mean of 100 pounds and a standard deviation of 38.5 pounds. Random samples of size 18 are drawn from this population and the mean of each sample is determined. μx=nothing
- (a) Consider a distribution or a data set with different values of mean, median and mode. Comment upon the shape of such a distribution in terms of the spread of the frequencies. What will be the relation between the mean, median and mode in such a case? Compare the shape of such a distribution with the one whose mean, median and mode are equal to each other.Use the central limit theorem to find the mean and standard error of the mean of the indicated sampling distribution. Then sketch a graph of the sampling distribution. The per capita consumption of red meat by people in a country in a recent year was normally distributed, with a mean of 106 pounds and a standard deviation of 38.6 pounds. Random samples of size 17 are drawn from this population and the mean of each sample is determined. Ux = Standard deviation =A patient is classified as having gestational diabetes if her glucose level is above 155 milligrams per deciliter (mg/dl) one hour after a sugary drink. Sheila's measured glucose level one hour after the sugary drink varies according to the normal distribution with �=140 mg/dl and �=12 mg/dl. Suppose Sheila repeats this process on three separate randomly selected days. What sample mean blood glucose level is higher than 95% of all other sample mean blood glucose levels? Use 2 decimal places.
- The graph illustrates a normal distribution for the prices paid for a particular model of HD television. The mean price paid is $1600 and the standard deviation is $150.1150130014501600175019002050Distribution of Prices[Graphs generated by this script: setBorder(10,30,10,5);initPicture(-3.5,3.5,-.1,.45);line([-153.5,0],[153.5,0]);line([-3,.02],[-3,-.02]);text([-3,-.01],"1150","below");line([-2,.02],[-2,-.02]);text([-2,-.01],"1300","below");line([-1,.02],[-1,-.02]);text([-1,-.01],"1450","below");line([0,.02],[0,-.02]);text([0,-.01],"1600","below");line([1,.02],[1,-.02]);text([1,-.01],"1750","below");line([2,.02],[2,-.02]);text([2,-.01],"1900","below");line([3,.02],[3,-.02]);text([3,-.01],"2050","below");textabs([200,0],'Distribution of…Use the central limit theorem to find the mean and standard error of the mean of the indicated sampling distribution. Then sketch a graph of the sampling distribution. The per capita consumption of red meat by people in a country in a recent year was normally distributed, with a mean of 109pounds and a standard deviation of 37.9 pounds. Random samples of size 19 are drawn from this population and the mean of each sample is determined. μx= σx=Use the central limit theorem to find the mean and standard error of the mean of the indicated sampling distribution. Then sketch a graph of the sampling distribution. The per capita consumption of red meat by people in a country in a recent year was normally distributed, with a mean of 104 pounds and a standard deviation of 38.5 pounds. Random samples of size 19 are drawn from this population and the mean of each sample is determined. μx= σx= (Round to three decimal places as needed.) Sketch a graph of the sampling distribution. Choose the correct graph below.