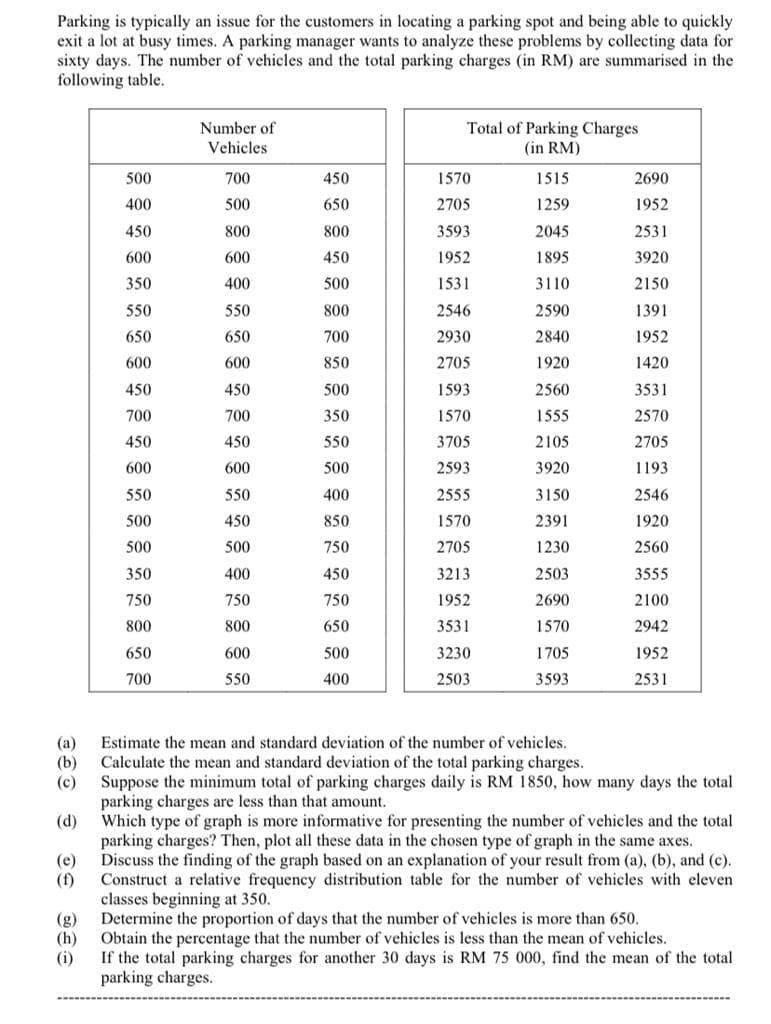
Parking is typically an issue for the customers in locating a parking spot and being able to quickly exit a lot at busy times. A parking manager wants to analyze these problems by collecting data for sixty days. The number of vehicles and the total parking charges (in RM) are summarised in the following table. Number of Vehicles Total of Parking Charges (in RM) 500 700 450 1570 1515 2690 400 500 650 2705 1259 1952 450 800 800 3593 2045 2531 600 600 450 1952 1895 3920 350 400 500 1531 3110 2150 550 550 800 2546 2590 1391 650 650 700 2930 2840 1952 600 600 850 2705 1920 1420 450 450 500 1593 2560 3531 700 700 350 1570 1555 2570 450 450 550 3705 2105 2705 600 600 500 2593 3920 1193 550 550 400 2555 3150 2546 500 450 850 1570 2391 1920 500 500 750 2705 1230 2560 350 400 450 3213 2503 3555 750 750 750 1952 2690 2100 800 800 650 3531 1570 2942 650 600 500 3230 1705 1952 700 550 400 2503 3593 2531 Estimate the mean and standard deviation of the number of vehicles. (a) (b) Calculate the mean and standard deviation of the total parking charges. (c) Suppose the minimum total of parking charges daily is RM 1850, how many days the total parking charges are less than that amount. (d) Which type of graph is more informative for presenting the number of vehicles and the total parking charges? Then, plot all these data in the chosen type of graph in the same axes. (e) Discuss the finding of the graph based on an explanation of your result from (a), (b), and (c). (f) Construct a relative frequency distribution table for the number of vehicles with eleven classes beginning at 350. Determine the proportion of days that the number of vehicles is more than 650. (g) (h) Obtain the percentage that the number of vehicles is less than the mean of vehicles. (i) If the total parking charges for another 30 days is RM 75 000, find the mean of the total parking charges.
Parking is typically an issue for the customers in locating a parking spot and being able to quickly exit a lot at busy times. A parking manager wants to analyze these problems by collecting data for sixty days. The number of vehicles and the total parking charges (in RM) are summarised in the following table. Number of Vehicles Total of Parking Charges (in RM) 500 700 450 1570 1515 2690 400 500 650 2705 1259 1952 450 800 800 3593 2045 2531 600 600 450 1952 1895 3920 350 400 500 1531 3110 2150 550 550 800 2546 2590 1391 650 650 700 2930 2840 1952 600 600 850 2705 1920 1420 450 450 500 1593 2560 3531 700 700 350 1570 1555 2570 450 450 550 3705 2105 2705 600 600 500 2593 3920 1193 550 550 400 2555 3150 2546 500 450 850 1570 2391 1920 500 500 750 2705 1230 2560 350 400 450 3213 2503 3555 750 750 750 1952 2690 2100 800 800 650 3531 1570 2942 650 600 500 3230 1705 1952 700 550 400 2503 3593 2531 Estimate the mean and standard deviation of the number of vehicles. (a) (b) Calculate the mean and standard deviation of the total parking charges. (c) Suppose the minimum total of parking charges daily is RM 1850, how many days the total parking charges are less than that amount. (d) Which type of graph is more informative for presenting the number of vehicles and the total parking charges? Then, plot all these data in the chosen type of graph in the same axes. (e) Discuss the finding of the graph based on an explanation of your result from (a), (b), and (c). (f) Construct a relative frequency distribution table for the number of vehicles with eleven classes beginning at 350. Determine the proportion of days that the number of vehicles is more than 650. (g) (h) Obtain the percentage that the number of vehicles is less than the mean of vehicles. (i) If the total parking charges for another 30 days is RM 75 000, find the mean of the total parking charges.

MATLAB: An Introduction with Applications
6th Edition
ISBN:9781119256830
Author:Amos Gilat
Publisher:Amos Gilat
Chapter1: Starting With Matlab
Section: Chapter Questions
Problem 1P

Related questions
Question
can i get the answer for g and below
Transcribed Image Text:Parking is typically an issue for the customers in locating a parking spot and being able to quickly
exit a lot at busy times. A parking manager wants to analyze these problems by collecting data for
sixty days. The number of vehicles and the total parking charges (in RM) are summarised in the
following table.
Total of Parking Charges
(in RM)
Number of
Vehicles
500
700
450
1570
1515
2690
400
500
650
2705
1259
1952
450
800
800
3593
2045
2531
600
600
450
1952
1895
3920
350
400
500
1531
3110
2150
550
550
800
2546
2590
1391
650
650
700
2930
2840
1952
600
600
850
2705
1920
1420
450
450
500
1593
2560
3531
700
700
350
1570
1555
2570
450
450
550
3705
2105
2705
600
600
500
2593
3920
1193
550
550
400
2555
3150
2546
500
450
850
1570
2391
1920
500
500
750
2705
1230
2560
350
400
450
3213
2503
3555
750
750
750
1952
2690
2100
800
800
650
3531
1570
2942
650
600
500
3230
1705
1952
700
550
400
2503
3593
2531
(a)
Estimate the mean and standard deviation of the number of vehicles.
(b)
Calculate the mean and standard deviation of the total parking charges.
(c)
Suppose the minimum total of parking charges daily is RM 1850, how many days the total
parking charges are less than that amount.
(d)
Which type of graph is more informative for presenting the number of vehicles and the total
parking charges? Then, plot all these data in the chosen type of graph in the same axes.
Discuss the finding of the graph based on an explanation of your result from (a), (b), and (c).
(e)
(f)
Construct a relative frequency distribution table for the number of vehicles with eleven
classes beginning at 350.
(g)
Determine the proportion of days that the number of vehicles is more than 650.
Obtain the percentage that the number of vehicles is less than the mean of vehicles.
(h)
(i)
If the total parking charges for another 30 days is RM 75 000, find the mean of the total
parking charges.
Expert Solution
This question has been solved!
Explore an expertly crafted, step-by-step solution for a thorough understanding of key concepts.

Step by step
Solved in 4 steps

Recommended textbooks for you
MATLAB: An Introduction with Applications
Statistics
ISBN:
9781119256830
Author:
Amos Gilat
Publisher:
John Wiley & Sons Inc

Probability and Statistics for Engineering and th…
Statistics
ISBN:
9781305251809
Author:
Jay L. Devore
Publisher:
Cengage Learning

Statistics for The Behavioral Sciences (MindTap C…
Statistics
ISBN:
9781305504912
Author:
Frederick J Gravetter, Larry B. Wallnau
Publisher:
Cengage Learning
MATLAB: An Introduction with Applications
Statistics
ISBN:
9781119256830
Author:
Amos Gilat
Publisher:
John Wiley & Sons Inc
Probability and Statistics for Engineering and th…
Statistics
ISBN:
9781305251809
Author:
Jay L. Devore
Publisher:
Cengage Learning
Statistics for The Behavioral Sciences (MindTap C…
Statistics
ISBN:
9781305504912
Author:
Frederick J Gravetter, Larry B. Wallnau
Publisher:
Cengage Learning

Elementary Statistics: Picturing the World (7th E…
Statistics
ISBN:
9780134683416
Author:
Ron Larson, Betsy Farber
Publisher:
PEARSON

The Basic Practice of Statistics
Statistics
ISBN:
9781319042578
Author:
David S. Moore, William I. Notz, Michael A. Fligner
Publisher:
W. H. Freeman

Introduction to the Practice of Statistics
Statistics
ISBN:
9781319013387
Author:
David S. Moore, George P. McCabe, Bruce A. Craig
Publisher:
W. H. Freeman