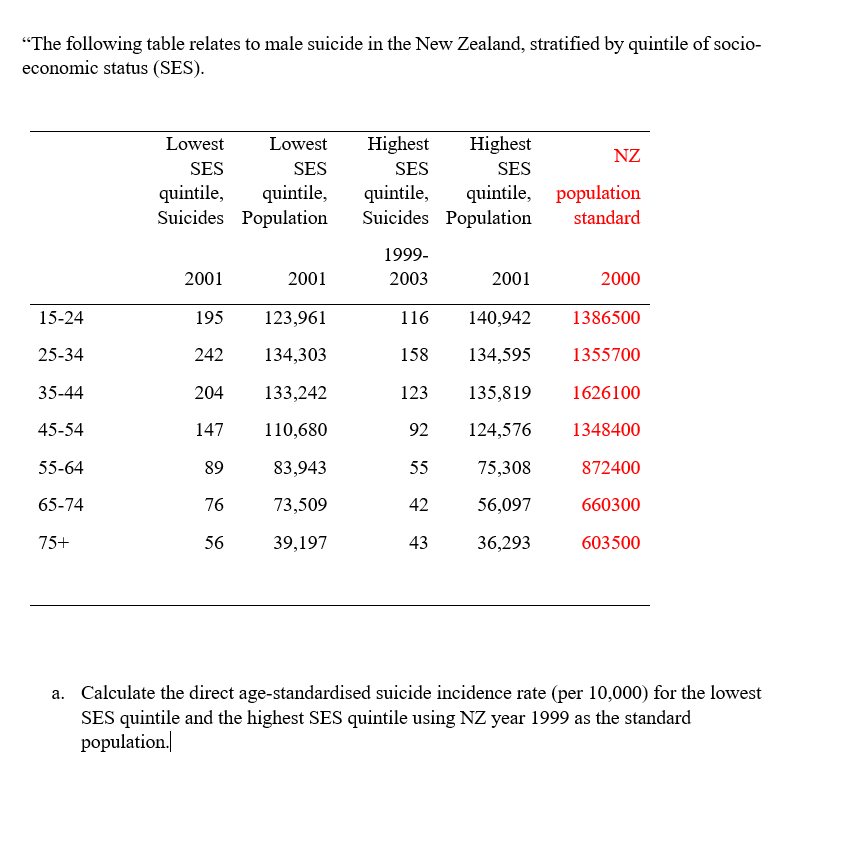
"The following table relates to male suicide in the New Zealand, stratified by quintile of socio- economic status (SES). Lowest Lowest Highest Highest NZ SES SES SES SES quintile, Suicides Population quintile, quintile, quintile, population Suicides Population standard 1999- 2001 2001 2003 2001 2000 15-24 195 123,961 116 140,942 1386500 25-34 242 134,303 158 134,595 1355700 35-44 204 133,242 123 135,819 1626100 45-54 147 110,680 92 124,576 1348400 55-64 89 83,943 55 75,308 872400 65-74 76 73,509 42 56,097 660300 75+ 56 39,197 43 36,293 603500 a. Calculate the direct age-standardised suicide incidence rate (per 10,000) for the lowest SES quintile and the highest SES quintile using NZ year 1999 as the standard population.


Angles in Circles
Angles within a circle are feasible to create with the help of different properties of the circle such as radii, tangents, and chords. The radius is the distance from the center of the circle to the circumference of the circle. A tangent is a line made perpendicular to the radius through its endpoint placed on the circle as well as the line drawn at right angles to a tangent across the point of contact when the circle passes through the center of the circle. The chord is a line segment with its endpoints on the circle. A secant line or secant is the infinite extension of the chord.
Arcs in Circles
A circular arc is the arc of a circle formed by two distinct points. It is a section or segment of the circumference of a circle. A straight line passing through the center connecting the two distinct ends of the arc is termed a semi-circular arc.
See question attached

Step by step
Solved in 3 steps


