he mean squared error of a regression is: Equal to R². O Equal to Adjusted R?. O A measure of fit. O Useful when testing whether all slope coefficients are jointly significant.
he mean squared error of a regression is: Equal to R². O Equal to Adjusted R?. O A measure of fit. O Useful when testing whether all slope coefficients are jointly significant.

Chapter1: Making Economics Decisions
Section: Chapter Questions
Problem 1QTC

Related questions
Question
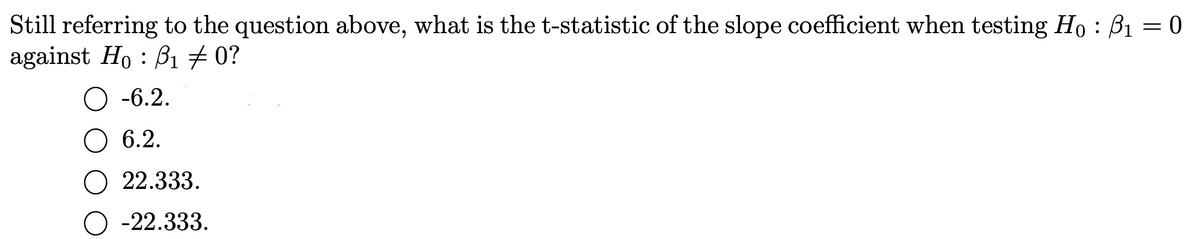
Transcribed Image Text:Still referring to the question above, what is the t-statistic of the slope coefficient when testing Ho : B1 = 0
against Ho : B1 # 0?
О -6.2.
O 6.2.
О 22.333.
О -22.333.
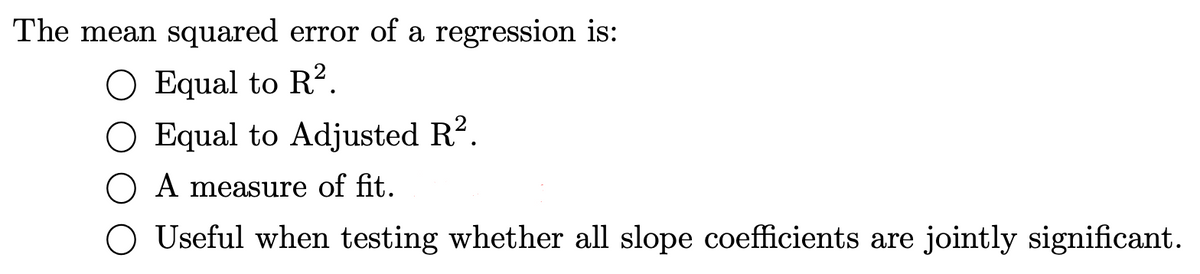
Transcribed Image Text:The mean squared error of a regression is:
O Equal to R².
O Equal to Adjusted R?.
O A measure of fit.
O Useful when testing whether all slope coefficients are jointly significant.
Expert Solution
This question has been solved!
Explore an expertly crafted, step-by-step solution for a thorough understanding of key concepts.

Step by step
Solved in 2 steps

Knowledge Booster


Learn more about
Need a deep-dive on the concept behind this application? Look no further. Learn more about this topic, economics and related others by exploring similar questions and additional content below.Recommended textbooks for you

Principles of Economics (12th Edition)
Economics
ISBN:
9780134078779
Author:
Karl E. Case, Ray C. Fair, Sharon E. Oster
Publisher:
PEARSON

Engineering Economy (17th Edition)
Economics
ISBN:
9780134870069
Author:
William G. Sullivan, Elin M. Wicks, C. Patrick Koelling
Publisher:
PEARSON
Principles of Economics (12th Edition)
Economics
ISBN:
9780134078779
Author:
Karl E. Case, Ray C. Fair, Sharon E. Oster
Publisher:
PEARSON
Engineering Economy (17th Edition)
Economics
ISBN:
9780134870069
Author:
William G. Sullivan, Elin M. Wicks, C. Patrick Koelling
Publisher:
PEARSON

Principles of Economics (MindTap Course List)
Economics
ISBN:
9781305585126
Author:
N. Gregory Mankiw
Publisher:
Cengage Learning

Managerial Economics: A Problem Solving Approach
Economics
ISBN:
9781337106665
Author:
Luke M. Froeb, Brian T. McCann, Michael R. Ward, Mike Shor
Publisher:
Cengage Learning

Managerial Economics & Business Strategy (Mcgraw-…
Economics
ISBN:
9781259290619
Author:
Michael Baye, Jeff Prince
Publisher:
McGraw-Hill Education