In the following regression Price = 119.2 + 0.485BDR+23.4Bath +0.156Hsize + 0.002Lsize +0.09 (23.9) (2.61) (8.94) (0.011) (0.00048) (0.311) (10.5) The F-statistic for omitting BDR and Age from the regression is F-statistic=0.08, which has a p-value=0.98. Are the coefficients on BDR and Age statistically significantly different from 0 at 5% level? O Yes, significantly different from 0 since the p-value>0.05. O No, not significantly different from 0 since the p-value>0.05. We don't know O depends on sample size
In the following regression Price = 119.2 + 0.485BDR+23.4Bath +0.156Hsize + 0.002Lsize +0.09 (23.9) (2.61) (8.94) (0.011) (0.00048) (0.311) (10.5) The F-statistic for omitting BDR and Age from the regression is F-statistic=0.08, which has a p-value=0.98. Are the coefficients on BDR and Age statistically significantly different from 0 at 5% level? O Yes, significantly different from 0 since the p-value>0.05. O No, not significantly different from 0 since the p-value>0.05. We don't know O depends on sample size

Managerial Economics: Applications, Strategies and Tactics (MindTap Course List)
14th Edition
ISBN:9781305506381
Author:James R. McGuigan, R. Charles Moyer, Frederick H.deB. Harris
Publisher:James R. McGuigan, R. Charles Moyer, Frederick H.deB. Harris
Chapter4A: Problems In Applying The Linear Regression Model
Section: Chapter Questions
Problem 1E

Related questions
Question
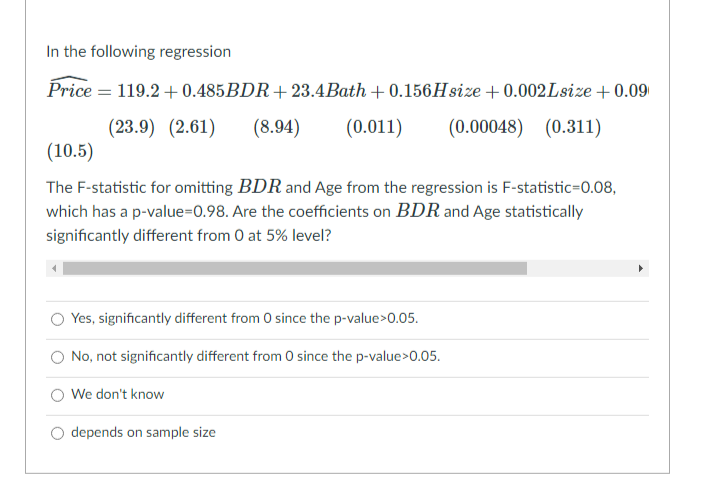
Transcribed Image Text:In the following regression
Price = 119.2 +0.485BDR+23.4Bath + 0.156Hsize +0.002Lsize + 0.09
(23.9) (2.61)
(8.94)
(0.011)
(0.00048) (0.311)
(10.5)
The F-statistic for omitting BDR and Age from the regression is F-statistic=0.08,
which has a p-value=0.98. Are the coefficients on BDR and Age statistically
significantly different from 0 at 5% level?
Yes, significantly different from 0 since the p-value>0.05.
O No, not significantly different from 0 since the p-value>0.05.
We don't know
O depends on sample size
Expert Solution
This question has been solved!
Explore an expertly crafted, step-by-step solution for a thorough understanding of key concepts.

This is a popular solution!

Trending now
This is a popular solution!

Step by step
Solved in 2 steps with 1 images

Recommended textbooks for you
Managerial Economics: Applications, Strategies an…
Economics
ISBN:
9781305506381
Author:
James R. McGuigan, R. Charles Moyer, Frederick H.deB. Harris
Publisher:
Cengage Learning
Managerial Economics: Applications, Strategies an…
Economics
ISBN:
9781305506381
Author:
James R. McGuigan, R. Charles Moyer, Frederick H.deB. Harris
Publisher:
Cengage Learning