2. (5 pts) Use the data provided below to prepare a Beer's Law plot in Excel. Plot absorbance on the y axis and concentration on the x axis. Add a trend line to your linear graph. Use your graph to determine the concentration of a sample measured to have and absorbance value of 0.35 absorbance units. Show on your graph how you determine the concentration of the unknown. Turn in your graph. Concentration (M) 0.20 Absorbance (A) 0.27 0.30 0.40 0.50 of cation Unknown concentration from graphical analysis. 0.41 0.55 0.69 M
2. (5 pts) Use the data provided below to prepare a Beer's Law plot in Excel. Plot absorbance on the y axis and concentration on the x axis. Add a trend line to your linear graph. Use your graph to determine the concentration of a sample measured to have and absorbance value of 0.35 absorbance units. Show on your graph how you determine the concentration of the unknown. Turn in your graph. Concentration (M) 0.20 Absorbance (A) 0.27 0.30 0.40 0.50 of cation Unknown concentration from graphical analysis. 0.41 0.55 0.69 M

Chemistry & Chemical Reactivity
10th Edition
ISBN:9781337399074
Author:John C. Kotz, Paul M. Treichel, John Townsend, David Treichel
Publisher:John C. Kotz, Paul M. Treichel, John Townsend, David Treichel
Chapter11: Intermolecular Forces And Liquids
Section11.6: Properties Of Liquids
Problem 1.2ACP

Related questions
Question
100%
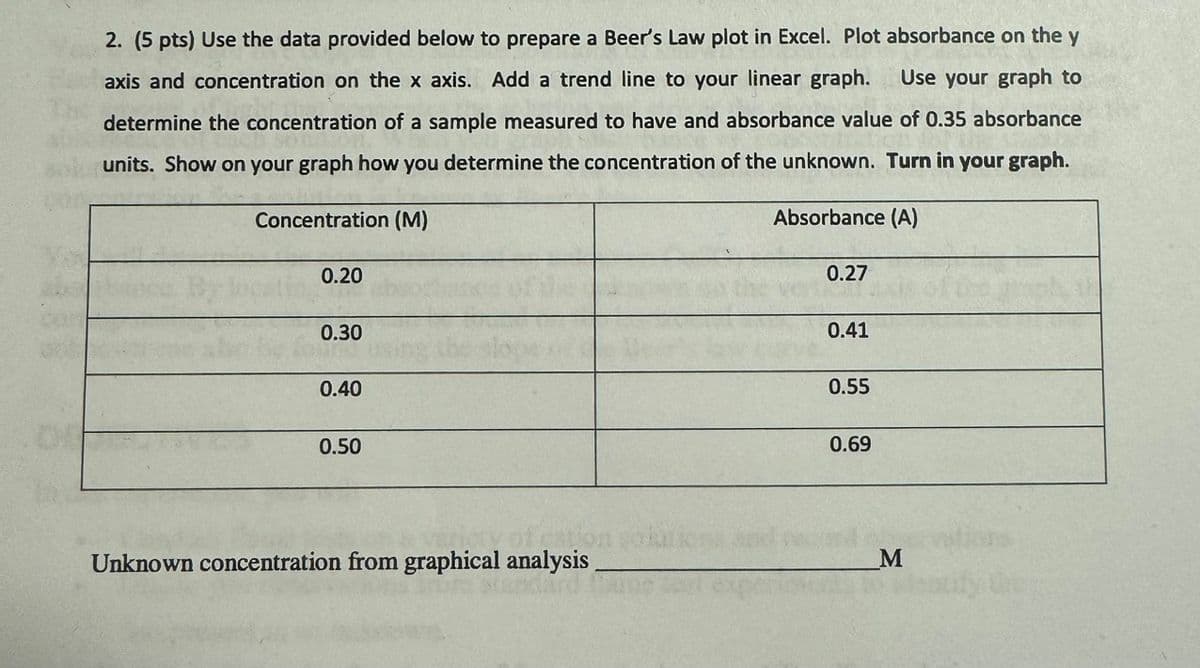
Transcribed Image Text:2. (5 pts) Use the data provided below to prepare a Beer's Law plot in Excel. Plot absorbance on the y
axis and concentration on the x axis. Add a trend line to your linear graph. Use your graph to
determine the concentration of a sample measured to have and absorbance value of 0.35 absorbance
units. Show on your graph how you determine the concentration of the unknown. Turn in your graph.
Concentration (M)
0.20
Absorbance (A)
0.27
0.30
0.40
0.50
of cation
Unknown concentration from graphical analysis.
0.41
0.55
0.69
M
Expert Solution
This question has been solved!
Explore an expertly crafted, step-by-step solution for a thorough understanding of key concepts.

Step by step
Solved in 2 steps with 1 images

Recommended textbooks for you
Chemistry & Chemical Reactivity
Chemistry
ISBN:
9781337399074
Author:
John C. Kotz, Paul M. Treichel, John Townsend, David Treichel
Publisher:
Cengage Learning
Chemistry & Chemical Reactivity
Chemistry
ISBN:
9781337399074
Author:
John C. Kotz, Paul M. Treichel, John Townsend, David Treichel
Publisher:
Cengage Learning