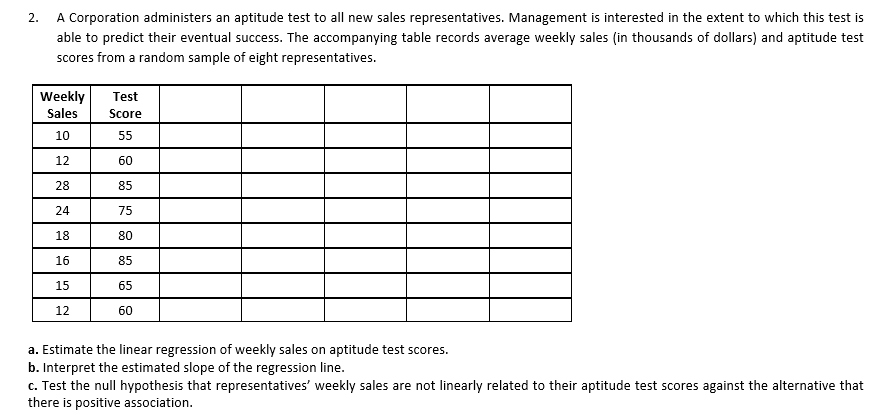
2. A Corporation administers an aptitude test to all new sales representatives. Management is interested in the extent to which this test is able to predict their eventual success. The accompanying table records average weekly sales (in thousands of dollars) and aptitude test scores from a random sample of eight representatives. Test Weekly Sales Score 10 55 12 60 28 85 24 75 18 80 16 85 15 65 12 60 a. Estimate the linear regression of weekly sales on aptitude test scores. b. Interpret the estimated slope of the regression line. c. Test the null hypothesis that representatives' weekly sales are not linearly related to their aptitude test scores against the alternative that there is positive association.
2. A Corporation administers an aptitude test to all new sales representatives. Management is interested in the extent to which this test is able to predict their eventual success. The accompanying table records average weekly sales (in thousands of dollars) and aptitude test scores from a random sample of eight representatives. Test Weekly Sales Score 10 55 12 60 28 85 24 75 18 80 16 85 15 65 12 60 a. Estimate the linear regression of weekly sales on aptitude test scores. b. Interpret the estimated slope of the regression line. c. Test the null hypothesis that representatives' weekly sales are not linearly related to their aptitude test scores against the alternative that there is positive association.

College Algebra
7th Edition
ISBN:9781305115545
Author:James Stewart, Lothar Redlin, Saleem Watson
Publisher:James Stewart, Lothar Redlin, Saleem Watson
Chapter1: Equations And Graphs
Section: Chapter Questions
Problem 10T: Olympic Pole Vault The graph in Figure 7 indicates that in recent years the winning Olympic men’s...

Related questions
Question
please not from excel. thanks in advance.
Transcribed Image Text:2. A Corporation administers an aptitude test to all new sales representatives. Management is interested in the extent to which this test is
able to predict their eventual success. The accompanying table records average weekly sales (in thousands of dollars) and aptitude test
scores from a random sample of eight representatives.
Test
Weekly
Sales
Score
10
55
12
60
28
85
24
75
18
80
16
85
15
65
12
60
a. Estimate the linear regression of weekly sales on aptitude test scores.
b. Interpret the estimated slope of the regression line.
c. Test the null hypothesis that representatives' weekly sales are not linearly related to their aptitude test scores against the alternative that
there is positive association.
Expert Solution
This question has been solved!
Explore an expertly crafted, step-by-step solution for a thorough understanding of key concepts.

This is a popular solution!

Trending now
This is a popular solution!

Step by step
Solved in 5 steps with 6 images

Knowledge Booster


Learn more about
Need a deep-dive on the concept behind this application? Look no further. Learn more about this topic, statistics and related others by exploring similar questions and additional content below.Recommended textbooks for you
College Algebra
Algebra
ISBN:
9781305115545
Author:
James Stewart, Lothar Redlin, Saleem Watson
Publisher:
Cengage Learning

Linear Algebra: A Modern Introduction
Algebra
ISBN:
9781285463247
Author:
David Poole
Publisher:
Cengage Learning

Glencoe Algebra 1, Student Edition, 9780079039897…
Algebra
ISBN:
9780079039897
Author:
Carter
Publisher:
McGraw Hill
College Algebra
Algebra
ISBN:
9781305115545
Author:
James Stewart, Lothar Redlin, Saleem Watson
Publisher:
Cengage Learning
Linear Algebra: A Modern Introduction
Algebra
ISBN:
9781285463247
Author:
David Poole
Publisher:
Cengage Learning
Glencoe Algebra 1, Student Edition, 9780079039897…
Algebra
ISBN:
9780079039897
Author:
Carter
Publisher:
McGraw Hill

Big Ideas Math A Bridge To Success Algebra 1: Stu…
Algebra
ISBN:
9781680331141
Author:
HOUGHTON MIFFLIN HARCOURT
Publisher:
Houghton Mifflin Harcourt