An air conditioning company located in Central Florida collected data for the number of air conarioning units sold in the Central Florida area and for the outside temperature on the day that sales took place. The Sales Manager put the following table together: Outside Temperature (Degrees F) 68 72 78 81 Sales (Number of air conditioning units sold) 3 5 12 84 15 86 16 89 22 91 93 18 19 94 26 Plot a scatter diagram for the data provided on the table above and the linear regression line calculated in topic (b). Consider that: : number of air conditioning units sold K: outside temperature (degrees F) Guidance: graph should look like the one presented in Figure 4.2 of textbook Perform the linear regression calculation and provide the linear regression equation that describes the relationship between Y (number of air conditioning units sold) and X (outside temperature in degrees Fahrenheit. Guidance: follow the steps presented on Table 4.2 of textbook ,Calculate SST, SSE and SSR for this linear regression Guidance: follow the steps presented on Table 4.3 of textbook "Calculate the coefficient of determination (r') and the coefficient of correlation (r).
An air conditioning company located in Central Florida collected data for the number of air conarioning units sold in the Central Florida area and for the outside temperature on the day that sales took place. The Sales Manager put the following table together: Outside Temperature (Degrees F) 68 72 78 81 Sales (Number of air conditioning units sold) 3 5 12 84 15 86 16 89 22 91 93 18 19 94 26 Plot a scatter diagram for the data provided on the table above and the linear regression line calculated in topic (b). Consider that: : number of air conditioning units sold K: outside temperature (degrees F) Guidance: graph should look like the one presented in Figure 4.2 of textbook Perform the linear regression calculation and provide the linear regression equation that describes the relationship between Y (number of air conditioning units sold) and X (outside temperature in degrees Fahrenheit. Guidance: follow the steps presented on Table 4.2 of textbook ,Calculate SST, SSE and SSR for this linear regression Guidance: follow the steps presented on Table 4.3 of textbook "Calculate the coefficient of determination (r') and the coefficient of correlation (r).

Glencoe Algebra 1, Student Edition, 9780079039897, 0079039898, 2018
18th Edition
ISBN:9780079039897
Author:Carter
Publisher:Carter
Chapter10: Statistics
Section10.6: Summarizing Categorical Data
Problem 4AGP

Related questions
Question
hello I just need help with the 3rd and fourth part
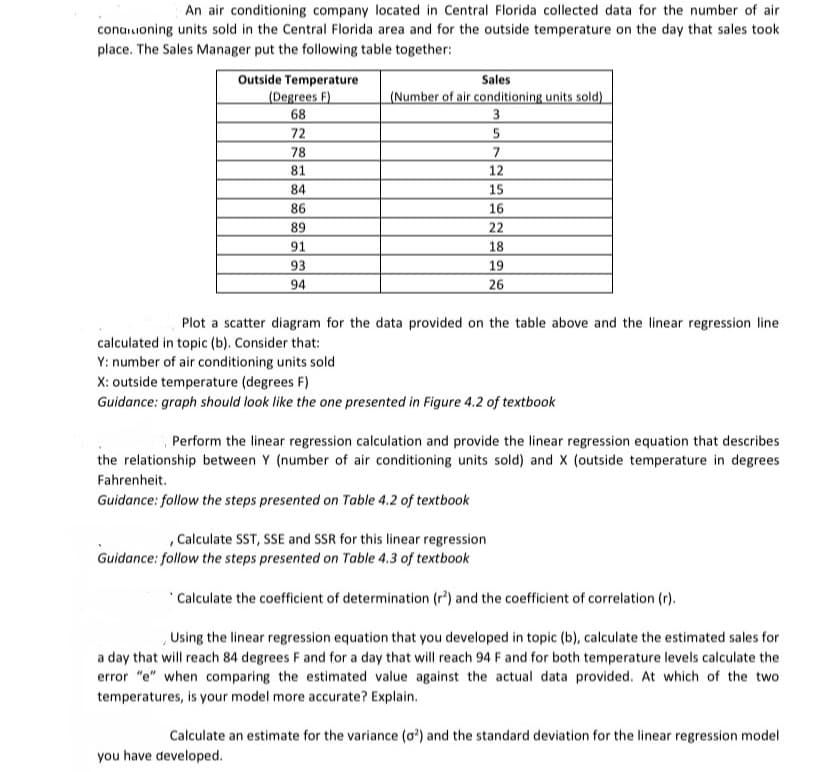
Transcribed Image Text:An air conditioning company located in Central Florida collected data for the number of air
conaruoning units sold in the Central Florida area and for the outside temperature on the day that sales took
place. The Sales Manager put the following table together:
Outside Temperature
(Degrees F)
68
Sales
(Number of air conditioning units sold)
3
5
72
78
81
12
84
15
86
16
89
22
91
18
93
19
26
94
Plot a scatter diagram for the data provided on the table above and the linear regression line
calculated in topic (b). Consider that:
Y: number of air conditioning units sold
X: outside temperature (degrees F)
Guidance: graph should look like the one presented in Figure 4.2 of textbook
Perform the linear regression calculation and provide the linear regression equation that describes
the relationship between Y (number of air conditioning units sold) and X (outside temperature in degrees
Fahrenheit.
Guidance: follow the steps presented on Table 4.2 of textbook
, Calculate SST, SSE and SSR for this linear regression
Guidance: follow the steps presented on Table 4.3 of textbook
"Calculate the coefficient of determination (r') and the coefficient of correlation (r).
Using the linear regression equation that you developed in topic (b), calculate the estimated sales for
a day that will reach 84 degrees F and for a day that will reach 94 F and for both temperature levels calculate the
error "e" when comparing the estimated value against the actual data provided. At which of the two
temperatures, is your model more accurate? Explain.
Calculate an estimate for the variance (o') and the standard deviation for the linear regression model
you have developed.
Expert Solution
This question has been solved!
Explore an expertly crafted, step-by-step solution for a thorough understanding of key concepts.

Step by step
Solved in 2 steps

Recommended textbooks for you
Glencoe Algebra 1, Student Edition, 9780079039897…
Algebra
ISBN:
9780079039897
Author:
Carter
Publisher:
McGraw Hill
Glencoe Algebra 1, Student Edition, 9780079039897…
Algebra
ISBN:
9780079039897
Author:
Carter
Publisher:
McGraw Hill