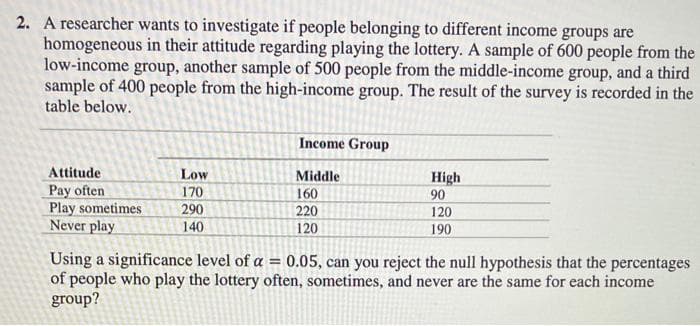
2. A researcher wants to investigate if people belonging to different income groups are homogeneous in their attitude regarding playing the lottery. A sample of 600 people from the low-income group, another sample of 500 people from the middle-income group, and a third sample of 400 people from the high-income group. The result of the survey is recorded in the table below. Attitude Pay often Play sometimes Never play Low 170 290 140 Income Group Middle 160 220 120 High 90 120 190 Using a significance level of a = 0.05, can you reject the null hypothesis that the percentages of people who play the lottery often, sometimes, and never are the same for each income group?
Q: Question 1 options: Nova has a pop quiz with 9 multiple choice questions. Each question has 3 answer…
A: “Since you have asked multiple questions, we will solve the first question for you. If you want any…
Q: The professor of a introductory calculus class has stated that, historically, the distribution of…
A: X is a random variable that follows the normal distribution with mean μ and SD σ then the z score…
Q: How hard is it to reach a businessperson by phone? Let p be the proportion of calls to…
A: Given that Margin of error =E =0.054 80% confidence level.
Q: John is 6 feet 2 inches tall. What measurement scale is this?
A: Given: John is 6 feet 2 inches.
Q: At many golf clubs, a teaching professional provides a free 10-minute lesson to new customers. A…
A: given data claim : μ ≠ $2200 we have to find null and alternative hypothesis and also interpret…
Q: how did you find the mean? why is it 72.5
A: Given data : The observation in increasing order is 30, 40, 50, 50,50, 55, 55, 55, 60, 65, 70, 70,…
Q: You really struggle remembering to bring your lunch to work. Each day seems to be independent as to…
A: Since you have posted a question with multiple sub parts, we will provide the solution only to the…
Q: 4. Wackerly 3.158 If Y is a random variable with moment-generating function m(t) and if W is given…
A: Solution
Q: Let x denote the amount of gravel sold (in tons) during a randomly selected week at a particular…
A: Let, X: the amount of gravel sold (in tons) Given: f(x) = 2 (1-x) 0 ≤ x ≤ 10…
Q: A coin is flipped 4 times. What is the probability of getting at least 3 heads? What is the…
A: GIVEN DATA, A coin is flipped 4 timesn=4p(head)=12=0.5p(tail)=12 =0.5probability of getting 2 heads…
Q: Maple Leaf Foods owns two machines (machine A and machine B) that operate independently of each…
A:
Q: Suppose every bag of skittles has the following probability distributio P(green)=16%…
A: P(green)=16% P(Orange)=19% P(Purple)= 18% P(Red)=23% P(Yellow)=24%
Q: can be this be handwritten? the formulas are a bit unclear
A:
Q: Pioneer Chicken advertises "le" chicken with 30% fewer calories than standard chicken. When the…
A:
Q: Suppose the probability distribution of x, the number of defective tires on a randomly selected car…
A: Given that Probability distribution table is. x 0 1 2 3 4 p(x) 0.52 0.18 0.05 0.03 0.22…
Q: The mean ACT composite score in a recent year is 20.8. A random sample of 36 ACT composite scores is…
A:
Q: The owner of a moving company typically has their most experienced manager predict the total number…
A: Given information: The data for the number of hours and the number of cubic feet is given.
Q: Pulse rates of women are normally distributed with a mean of 77.5 beats per minute and a standard…
A: Given that The pulse rates of women are normally distributed. The random variable X is the pulse…
Q: The amounts of nicotine in Dytusoon cigarettes have a mean of 0.941 g and a standard deviation of…
A: given data normal distributionμ = 0.941σ = 0.313n = 40x¯ = 0.882
Q: (b) Compute the MSE for the four-week moving average forecasts. (Round your answer to two decimal…
A: Given that, The data is as follows, Week sales 1 18 2 22 3 19 4 24 5 19 6 16 7 21…
Q: can you do problem 4 as well
A: Given that, X has a following continuous distribution:- f(x) = x23 , -1≤x≤2
Q: Tutorial Exercise A random sample is selected from a population with mean = 160 and standard…
A: Given,population mean(μ)=160population standard deviation(σ)=13
Q: 1. The probability of success remains constant from trial to trial in a binomial experiment. 2. In a…
A: State whether the given statements are true or false.
Q: Descriptive epidemiology characterizes the amount and distribution of disease within a population…
A: ANSWER: Descriptive epidemiology can enable the researcher to assess health and disease trends in a…
Q: Two events are independent events if the occurrence of one event does not affect the likelihood that…
A: Given that, Two events are independent events if the occurrence of one event does not affect the…
Q: The overhead reach distances of adult females are normally distributed with a mean of 197.5 cm and a…
A: given data, normal distribution μ=197.5 cmσ=8.9 cmwe have to find out the given probabilities
Q: 22. What is the power of each of the following studies, using a t test for dependent means (based on…
A: To calculate power, we need to know the effect size, sample size, alpha level, and the number of…
Q: 12. Calculate the following probabilities using the corresponding table. Experimental distribution…
A:
Q: Suppose that they said that the item you bought online will be delivered between 2 and 8 o'clock…
A: Note: Hi there! Thank you for posting the questions. As there are multiple sub parts, according to…
Q: The song-length of tunes in the Big Hair playlist of a Statistics professor's mp3-player varies from…
A: Note: Hi there! Thank you for posting the questions. As there are multiple sub parts, according to…
Q: Fill in the missing values and how many levels were used for factor B and how many replicates of the…
A: The partial output of the two-way ANOVA is given. The two variables are denoted by A and B. Given…
Q: An interesting experiment was described in the paper "Sociochemosensory and Emotional Functions."†…
A: Given information: x is the number of correct identification following binomial with n=5, p=14=0.25.
Q: the z-score corresponding to X = 24 and the X value corresponding to z = 1.50 for each of the…
A: Here AS PER POLICY I HAVE CALCULATED FIRST 3 SUBPARTS KINDLY REPOST FOR REMAINING PARTS WITH NOTE I…
Q: Create CI’s and PI’s (that are W-H adjusted) for all 8 X1*X2 combinations in the experiment. Explain…
A: Given, The upper confidence limit and lower confidence limit are also the upper and lower value of…
Q: A mail-order catalog business that sells personal computer supplies, software, and hardware…
A: Given the data as Months Distribution Cost ($thousands) Number of Orders 1 52.95…
Q: 9. Build the theoretical probability distribution function based on the experiment you completed.…
A: Q9. Let X be the random variable that the card is a diamond. n = no. of cards drawing = 10 The card…
Q: The amount of time it takes an Intro to Statistics instructor to grade an individual exam is a…
A: Given that Sample size (n)=64 Population mean μ=3 Standard deviation σ=1 Let X denotes the amount…
Q: Five hundred sixteen (516) homes in a certain southern California community are randomly surveyed to…
A: Given that, The sample size n=516 The number of favorable outcomes is as follows, x=179 The sample…
Q: Problem 3 Cars get parked in a lot (with infinite capacity) according to a X-rate Poisson process,…
A: Let T1,T2,... be the arrival times of the cars. Then N(t) is the number of cars that have arrived by…
Q: Annual retail store revenue for a technology company from 2007 to 2017 are shown below. Year Period…
A: Here we use excel Software enter data in excel click on insert click on scatter
Q: How many different arrangements of the word PARRAMATA are possible?
A: (4) Given word PARRAMATA
Q: How can I make a model between two variables with an exponential relation between them in R-Studio…
A: Here are the steps to create a new R Markdown file: Open R Studio. Click on "File" in the menu bar.…
Q: 72% of all Americans live in cities with population greater than 100,000 people. If 41 Americans are…
A: Givenprobability of all americans live in cities with population greater than100000…
Q: confidence interval
A:
Q: A sample consists of the following n = 5 scores: 8, 4, 10, 0, and 3 Compute the mean and standard…
A: Given The data is as follows: n = 5 scores 8, 4, 10, 0, and 3
Q: Could the explanation of how each cardinality set is determined be described?
A: Cardinality : It is the number of elements in a mathematical set. In question there are three…
Q: Given an approximately normal distribution with a mean of 121 and a standard devi- ion of 40. Using…
A: Given that. X~N( μ , ?) μ=121, ?=40 Z-score =( x - μ )/?
Q: A random variable follows a binomial distribution with the probability of success for one trial at…
A: Let a random variable X follows a binomial distribution.X~binomial(n,p)where number of…
Q: Questions Exercise 07.19 (Sampling Distribution of x) 1. 2. O O Question 1 of 2 ► b. Answer part (a)…
A: Given,mean(μ)=$71,800standard deviaton(σ)=$4000
Q: Suppose a basketball player has a free throw success rate of 75%. If she takes 4 free throws in a…
A: given that, a basketball player has a free throw success rate of 75%.
Trending now
This is a popular solution!
Step by step
Solved in 2 steps with 1 images
- Marine biologists have noticed that the color of the outermost growth band on a clam tends to be related to the time of year in which the clam dies. A biologist conducted a small investigation of whether this is true for the species Protothaca staminea. She collected a sample of 55 clam shells in February and 55 clam shells in March. 14 of the shells from February had a dark color on the outermost growth band, whereas 8 of the shells from March had a dark color on the outermost growth band. Carry out a hypothesis test to see if there is a difference in the proportion of shells with a dark outermost growth band between the two months; specifically, if the population proportion in February is higher than March. Let ? = 0.1.Note: Do all calculations as February - MarchA) The point estimate for the true difference in proportion of dark growth bands between February and March is: Note: answer using 4 decimal precisionB) The test statistic, ztest, is: Note: answer using 2 decimal…From time to time, the UTM Human Resource (UTMHR) department observes various employees fortheir work productivity. Recently UTMHR wanted to check whether the four employees at theDepartment XYZ counters, serve on average the same number of customers per hour. The HR managerobserved each of the four employees for a certain number of hours. The following Table 5 gives thenumber of customers served by the four employees during each of the observed hours. employee a employee b employee c employee d 19 14 11 24 21 16 14 19 26 14 21 21 24 13 13 26 18 17 16 20 employee a employee b employee c employee d mean 21.6 14.8 15.0 22.0 s 3.4 ? 3.8 ? c) Find variance between sample,d) Find variance within sample, e) Calculate the test statistic, F.f) Determine the numerator and denominator.g) Find the critical value of F at the 5% significance level, and test the claim that the mean numberof customers served per hour by each of these four employees is…From time to time, the UTM Human Resource (UTMHR) department observes various employees fortheir work productivity. Recently UTMHR wanted to check whether the four employees at theDepartment XYZ counters, serve on average the same number of customers per hour. The HR managerobserved each of the four employees for a certain number of hours. The following Table 5 gives thenumber of customers served by the four employees during each of the observed hours. employee a employee b employee c employee d 19 14 11 24 21 16 14 19 26 14 21 21 24 13 13 26 18 17 16 20 a) Define the hypothesis null, H0 and hypothesis alternative, H1.b) Given below are means and standard deviation for some of the employees. Calculate thestandard deviation for Employee B and D.
- Dogs are inbred for such desirable characteristics as blue eye color; but an unfortunate by-product of such inbreeding can be the emergence of characteristics such as deafness. A 1992 study of Dalmatians (by Strain and others, as reported in The Dalmatians Dilemma) found the following: (i) 31% of all Dalmatians have blue eyes. (ii) 38% of all Dalmatians are deaf. (iii) 42% of blue-eyed Dalmatians are deaf. Based on the results of this study is "having blue eyes" independent of "being deaf"? No, since .31 * .38 is not equal to .42. No, since .38 is not equal to .42. No, since .31 is not equal to .42. Yes, since .31 * .38 is not equal to .42. Yes, since .38 is not equal to .42. Submit QuestionQuestion 13At a certain school 60 of the 100 boys and 60 of the 80 girls signed up for the senior trip. Is there an associa-tion between going on the trip and gender? A) We can’t tell, because the class doesn’t have the samenumber of boys and girls.B) Yes, because the same number of boys and girlssigned up.C) Yes, because a lower percentage of boys signed upthan of girls.D) No, because the people on the trip were 50% boysand 50% girls.E) No, because the sign-up rate was higher among girlsthan among boys.The owner of a pet store is trying to decide whether to discontinue selling specialty clothes for pets. She suspects that only 10% of the customers buy specialty clothes for their pets and thinks that she might be able to replace the clothes with more interesting and profitable items on the shelves. Before making a final decision she decides to keep track of the total number of customers for a day, and whether they purchase specialty clothes for their pet. a) Assuming the pet store owner is correct in thinking that only 10% of her customers purchase specialty clothes for their pets, how many customers should she expect before someone buys a garment for their pet? b) What is the probability that she does not sell a garment until the 5th customer? c) What is the probability that exactly 4 of the first 10 customers buy specialty clothes for their pet? d) What is the probability that at least 3 of the first 35 customers buy specialty clothes for their pet?…
- In the binary data below "1" is assigned to students who are business majors in a statistics class and "0" is for all other majors. 1 1 1 0 1 1 1 1 0 1 1 1 1 1 1 1 1 1 0 1 1 1 1 1 1 1 1 1 1 1 1 1 1 0 1 0 1 1 1 1 1 1 0 1 1 1 1 0 1 0 0 1 1 1 1 1 1 0 1 1 1 1 1 1 1 1 1 0 0 1 1 1 1 1 1 0 1 1 1 1 1 0 1 1 1 1 1 1 1 1 0 1 1 1 1 1 0 1 1 1 0 1 1 0 1 1 1 1 1 1 1 1 1 0 1 1 1 1 0 0 1 0 1 1 1 1 1 1 1 1 1 1 1 1 1 1 1 1 1 1 18 The variance of the binary data is: a 0.1324 b 0.1409 c 0.1499 d 0.1595A fourth-grade teacher suspects that the time she administers a test, and what sort of snack her students have before the test, affects their performance. To test her theory, she assigns 90 fourth-grade students to one of three groups. One group gets candy (jelly beans) for their 9:55 AM snack. Another group gets a high-protein snack (cheese) for their 9:55 AM snack. The third group does not get a 9:55 AM snack. The teacher also randomly assigns 10 of the students in each snack group to take the test at three different times: 10:00 AM (right after snack), 11:00 AM (an hour after snack), and 12:00 PM (right before lunch). Examining the graph and the table of means, which of the following is a null hypothesis that might be rejected using a two-factor analysis of variance? Check all that apply. There is no interaction between the type of snack and the time of test μ10:00 AM10:00 AM ≠ μ11:00 AM11:00 AM ≠ μ12:00 PM12:00 PM μ10:00 AM10:00 AM = μ11:00 AM11:00 AM =…The gene ACTN3 encodes a protein that assists fast-twitch muscles. The three possible genotypes are RR, RX, and XX. Genotype was assessed in three groups: non-athletes, elite sprinters, and elite endurance runners. RR RX XX Total Non-athletes 130 226 80 436 Sprinters 53 48 6 107 Endurance 60 88 46 194 Total 243 362 132 737 Calculate P(XX | sprinter) Is genotype independent of group? Justify your answer with an appropriate equality or inequality between two probabilities.