1.2. What kind of data is given in the table above. 1.3. Do you expect a positive or negative relationship between variables? 1.4. Make a scatter plot of the GDP per capita and exports in Excel and interpret the graph
1.2. What kind of data is given in the table above. 1.3. Do you expect a positive or negative relationship between variables? 1.4. Make a scatter plot of the GDP per capita and exports in Excel and interpret the graph

Algebra & Trigonometry with Analytic Geometry
13th Edition
ISBN:9781133382119
Author:Swokowski
Publisher:Swokowski
Chapter9: Systems Of Equations And Inequalities
Section9.8: Determinants
Problem 31E

Related questions
Topic Video
Question
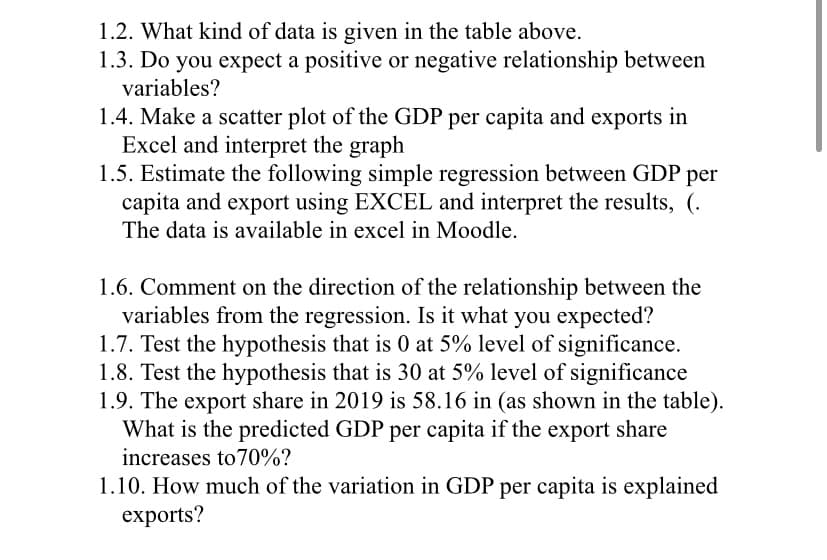
Transcribed Image Text:1.2. What kind of data is given in the table above.
1.3. Do you expect a positive or negative relationship between
variables?
1.4. Make a scatter plot of the GDP per capita and exports in
Excel and interpret the graph
1.5. Estimate the following simple regression between GDP per
capita and export using EXCEL and interpret the results, (.
The data is available in excel in Moodle.
1.6. Comment on the direction of the relationship between the
variables from the regression. Is it what you expected?
1.7. Test the hypothesis that is 0 at 5% level of significance.
1.8. Test the hypothesis that is 30 at 5% level of significance
1.9. The export share in 2019 is 58.16 in (as shown in the table).
What is the predicted GDP per capita if the export share
increases to70%?
1.10. How much of the variation in GDP per capita is explained
exports?
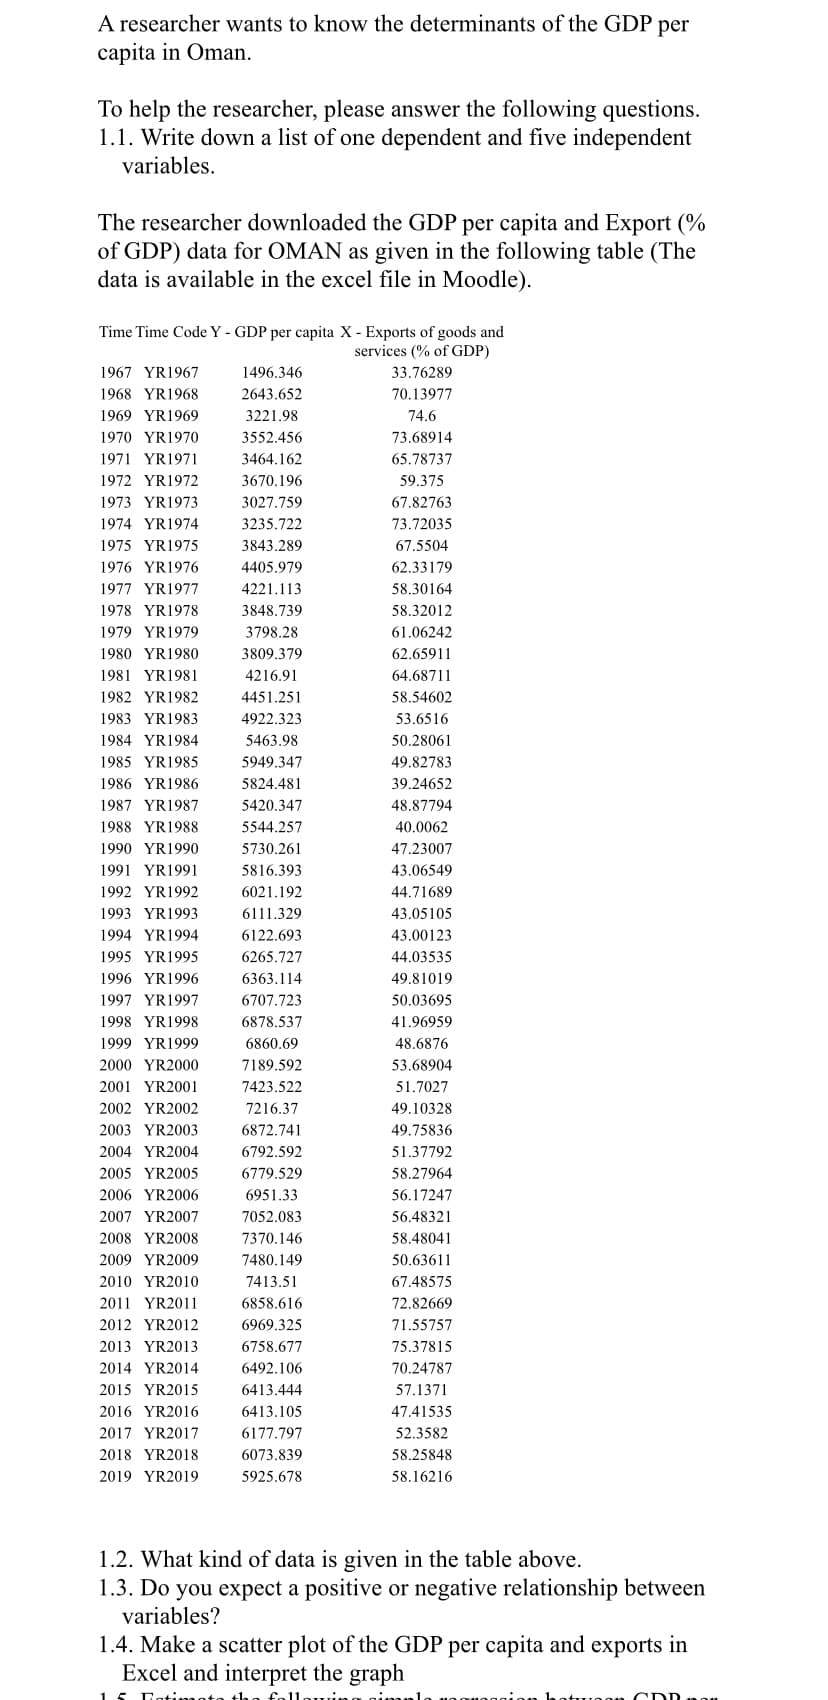
Transcribed Image Text:A researcher wants to know the determinants of the GDP per
capita in Oman.
To help the researcher, please answer the following questions.
1.1. Write down a list of one dependent and five independent
variables.
The researcher downloaded the GDP per capita and Export (%
of GDP) data for OMAN as given in the following table (The
data is available in the excel file in Moodle).
Time Time Code Y - GDP per capita X - Exports of goods and
services (% of GDP)
1967 YR1967
1496.346
33.76289
1968 YR1968
2643.652
70.13977
1969 YR1969
3221.98
74.6
1970 YR1970
3552.456
73.68914
1971 YR1971
3464.162
65.78737
1972 YR1972
3670.196
59.375
1973 YR1973
3027.759
67.82763
1974 YR1974
3235.722
73.72035
1975 YR1975
3843.289
67.5504
1976 YR1976
4405.979
62.33179
1977 YR1977
4221.113
58.30164
1978 YR1978
3848.739
58.32012
1979 YR1979
3798.28
61.06242
1980 YR1980
3809.379
62.65911
1981 YR1981
4216.91
64.68711
1982 YR1982
4451.251
58.54602
1983 YR1983
4922.323
53.6516
1984 YR1984
5463.98
50.28061
1985 YR1985
5949.347
49.82783
1986 YR1986
5824.481
39.24652
1987 YR1987
5420.347
48.87794
1988 YR1988
5544.257
40.0062
1990 YR1990
5730.261
47.23007
1991 YR1991
5816.393
43.06549
1992 YR1992
6021.192
44.71689
1993 YR1993
6111.329
43.05105
1994 YR1994
6122.693
43.00123
1995 YR1995
6265.727
44.03535
1996 YR1996
6363.114
49.81019
1997 YR1997
6707.723
50.03695
1998 YR1998
6878,537
41.96959
1999 YR1999
6860.69
48.6876
2000 YR2000
7189.592
53.68904
2001 YR2001
7423.522
51.7027
2002 YR2002
7216.37
49.10328
2003 YR2003
6872.741
49.75836
2004 YR2004
6792.592
51.37792
2005 YR2005
6779.529
58.27964
2006 YR2006
6951.33
56.17247
2007 YR2007
7052.083
56.48321
2008 YR2008
7370.146
58.48041
2009 YR2009
7480.149
50.63611
2010 YR2010
7413,51
67.48575
2011 YR2011
6858.616
72.82669
2012 YR2012
6969.325
71.55757
2013 YR2013
6758.677
75.37815
2014 YR2014
6492.106
70.24787
2015 YR2015
6413.444
57.1371
2016 YR2016
6413.105
47.41535
2017 YR2017
6177.797
52.3582
2018 YR2018
6073.839
58.25848
2019 YR2019
5925.678
58.16216
1.2. What kind of data is given in the table above.
1.3. Do you expect a positive or negative relationship between
variables?
1.4. Make a scatter plot of the GDP per capita and exports in
Excel and interpret the graph
CDD
Expert Solution
This question has been solved!
Explore an expertly crafted, step-by-step solution for a thorough understanding of key concepts.

Step by step
Solved in 2 steps with 2 images

Knowledge Booster


Learn more about
Need a deep-dive on the concept behind this application? Look no further. Learn more about this topic, statistics and related others by exploring similar questions and additional content below.Recommended textbooks for you
Algebra & Trigonometry with Analytic Geometry
Algebra
ISBN:
9781133382119
Author:
Swokowski
Publisher:
Cengage

Linear Algebra: A Modern Introduction
Algebra
ISBN:
9781285463247
Author:
David Poole
Publisher:
Cengage Learning

Elementary Linear Algebra (MindTap Course List)
Algebra
ISBN:
9781305658004
Author:
Ron Larson
Publisher:
Cengage Learning
Algebra & Trigonometry with Analytic Geometry
Algebra
ISBN:
9781133382119
Author:
Swokowski
Publisher:
Cengage
Linear Algebra: A Modern Introduction
Algebra
ISBN:
9781285463247
Author:
David Poole
Publisher:
Cengage Learning
Elementary Linear Algebra (MindTap Course List)
Algebra
ISBN:
9781305658004
Author:
Ron Larson
Publisher:
Cengage Learning

College Algebra (MindTap Course List)
Algebra
ISBN:
9781305652231
Author:
R. David Gustafson, Jeff Hughes
Publisher:
Cengage Learning

