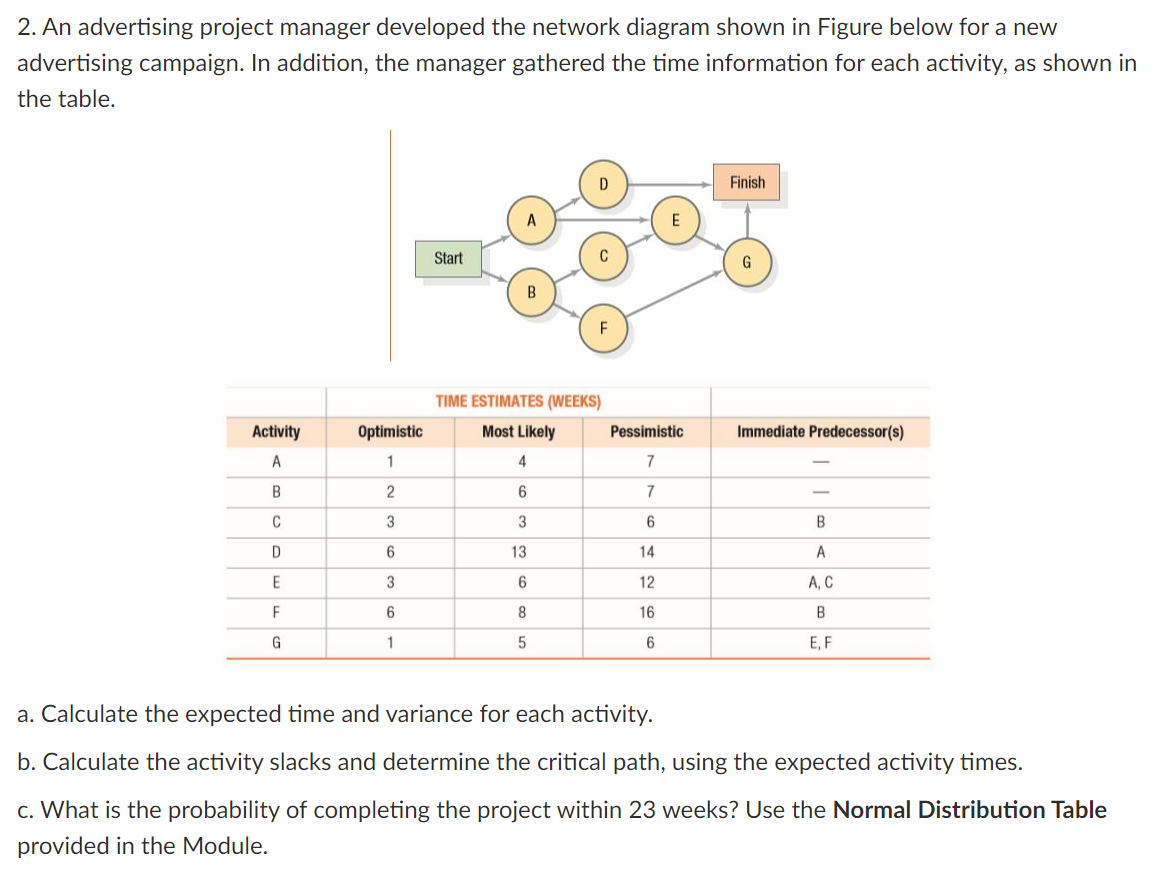
2. An advertising project manager developed the network diagram shown in Figure below for a new advertising campaign. In addition, the manager gathered the time information for each activity, as shown in the table. Finish Start G TIME ESTIMATES (WEEKS) TTTTT Activity Optimistic Most Likely Pessimistic Immediate Predecessor(s) A 1 4 7 2 7 - C 3 13 14 A E 3 12 A, C F 6 16 B 1 5 6 E, F a. Calculate the expected time and variance for each activity. b. Calculate the activity slacks and determine the critical path, using the expected activity times. c. What is the probability of completing the project within 23 weeks? Use the Normal Distribution Table provided in the Module.
2. An advertising project manager developed the network diagram shown in Figure below for a new advertising campaign. In addition, the manager gathered the time information for each activity, as shown in the table. Finish Start G TIME ESTIMATES (WEEKS) TTTTT Activity Optimistic Most Likely Pessimistic Immediate Predecessor(s) A 1 4 7 2 7 - C 3 13 14 A E 3 12 A, C F 6 16 B 1 5 6 E, F a. Calculate the expected time and variance for each activity. b. Calculate the activity slacks and determine the critical path, using the expected activity times. c. What is the probability of completing the project within 23 weeks? Use the Normal Distribution Table provided in the Module.

Practical Management Science
6th Edition
ISBN:9781337406659
Author:WINSTON, Wayne L.
Publisher:WINSTON, Wayne L.
Chapter2: Introduction To Spreadsheet Modeling
Section: Chapter Questions
Problem 20P: Julie James is opening a lemonade stand. She believes the fixed cost per week of running the stand...

Related questions
Question
Transcribed Image Text:2. An advertising project manager developed the network diagram shown in Figure below for a new
advertising campaign. In addition, the manager gathered the time information for each activity, as shown in
the table.
Finish
Start
B
TIME ESTIMATES (WEEKS)
Activity
Optimistic
Most Likely
Pessimistic
Immediate Predecessor(s)
A
1
4
7
В
2
6.
7
C
3
B
D
6
13
14
A
E
3.
12
A, C
F
6.
8
16
G
1
E, F
a. Calculate the expected time and variance for each activity.
b. Calculate the activity slacks and determine the critical path, using the expected activity times.
c. What is the probability of completing the project within 23 weeks? Use the Normal Distribution Table
provided in the Module.
Expert Solution
This question has been solved!
Explore an expertly crafted, step-by-step solution for a thorough understanding of key concepts.

This is a popular solution!

Trending now
This is a popular solution!

Step by step
Solved in 2 steps with 3 images

Recommended textbooks for you
Practical Management Science
Operations Management
ISBN:
9781337406659
Author:
WINSTON, Wayne L.
Publisher:
Cengage,

Operations Management
Operations Management
ISBN:
9781259667473
Author:
William J Stevenson
Publisher:
McGraw-Hill Education

Operations and Supply Chain Management (Mcgraw-hi…
Operations Management
ISBN:
9781259666100
Author:
F. Robert Jacobs, Richard B Chase
Publisher:
McGraw-Hill Education
Practical Management Science
Operations Management
ISBN:
9781337406659
Author:
WINSTON, Wayne L.
Publisher:
Cengage,
Operations Management
Operations Management
ISBN:
9781259667473
Author:
William J Stevenson
Publisher:
McGraw-Hill Education
Operations and Supply Chain Management (Mcgraw-hi…
Operations Management
ISBN:
9781259666100
Author:
F. Robert Jacobs, Richard B Chase
Publisher:
McGraw-Hill Education


Purchasing and Supply Chain Management
Operations Management
ISBN:
9781285869681
Author:
Robert M. Monczka, Robert B. Handfield, Larry C. Giunipero, James L. Patterson
Publisher:
Cengage Learning

Production and Operations Analysis, Seventh Editi…
Operations Management
ISBN:
9781478623069
Author:
Steven Nahmias, Tava Lennon Olsen
Publisher:
Waveland Press, Inc.