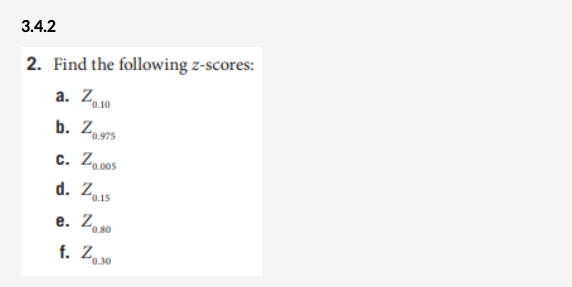
2. Find the following z-scores: a. Za10 b. Z.975 c. Z,005 0.005 d. Zs Zo30 "0.80 "0.30


Q: On the right are ratings for passers in a football league. Find the three quartiles for the ratings.…
A: We’ll answer the first question since the exact one wasn’t specified. Please submit a new question…
Q: 0% IC'O7 crushed walnuts 14.29%
A: A test for two paired samples is a hypothesis test that attempts to make a claim about population…
Q: What is the mean for the following score 2,5,4,18
A:
Q: Data was collected for a sample of organic snacks. The summarized in the histogram below. 14 12
A: Histogram is the graphical representation of the continuous frequency distribution of the data set…
Q: What is the mean for the following score 2,5,4,1,8
A:
Q: First Convert the following values into Z-scores. Then identify the proportion and probability in…
A: a) Given data
Q: A sample was done, collecting the data below. Calc 10 22 28 14
A: Given information: The sample data is provided as: x 10 22 28 14 7 It is to…
Q: For a population with u= 100 and o =20, find the X value that corresponds to the following z- Score=…
A:
Q: For a sample of M=50 and s=12 what is the x-value corresponding to z=-.25
A: Given: Z = -0.25 M = 50 s = 12
Q: what is the z score that corresponds to P18
A: The standard normal variable Z follows normal distribution with mean 0 and standard deviation 1.
Q: Find and interpret the z-score for Montana, which had 1.9% foreign-born residents.
A: a) The percentage of foreign-born residents is 1.9%. That is, score=1.9 From the output, mean=8.73…
Q: What percentage of the sample were female drivers?
A: It is given that Total = 5+7+11+9 = 32 Number of females = 7+9 = 16
Q: se a study revealed 5*
A: Given, a study revealed 57% of all subjects possessed trait A, 28% possessed trait B, and…
Q: Find sample size CI=75% E=3.61 Stand. dev.=6.78
A:
Q: 12 13 14 15 16 17 18 data Based on the boxplot above, identify the 5 number summary
A:
Q: B. Determine sample of the given problem below 1. N= 154,000 and e = 8% 2. N = 120,000 and e = 6% 3.…
A: Since you posted a question with multiple subparts, we will solve first three subparts for you. To…
Q: Given a population of 5000 scores with mean µ = 86 and o= 10. How many scores 4. between 76 and 86?
A:
Q: A sample has SS= 20 and s2 =4. How many scores are in the sample?
A:
Q: Find the IQR for the following data values: 375, 210, 150, 147, 429, 389, 580, 507, 180. 303 O a. O…
A: Arranging the data values in ascending order: 147, 150, 180, 210, 375, 389, 429, 507, 580 Number of…
Q: A man has an adopted grandson. After examining him at his 2-year checkup, the boy's pediatrician…
A: For a variable, X~N(μ,σ2), the z-score is, Z=X-μσwhereμ=population meanσ=population standard…
Q: Claim: u> 1300; a= 0.06; o = 202.14. Sample statistics: x= 1316.85, n= 275 .....
A: Given that Claim : μ>1300 ; Level of significance (α) = 0.06 Standard deviation (σ) = 202.14…
Q: 3. Use the data set below to find the following: Data Frequency Item 30 35 40 45 8/279
A:
Q: find the value between z score -2.9 and 1.5287
A: To find: Find the value between z score -2.9 and 1.5287
Q: C) What percentage of CT scans in this target population would be positive?
A: Given: P(Cancer) = 3% = 0.03 P(No cancer) = 1-0.03 = 0.97. P(test positive|cancer) = 89% = 0.89…
Q: Given the data set: 188 , 192 , 316 , 362 , 437, 589, a. Determine the 3 quartiles of the data set.…
A:
Q: The scores on a statewide chemistry exam were normally distributed with ?=73.08 and ?=6. Gabriela…
A: Given data isMean(μ)=73.08standard deviation(σ)=6
Q: How many males were surveyed?
A: It is given that Total = 516 Number of females = 259 Number of males = 257
Q: The following data are the monthly salaries and the grade point averages for students who obtained a…
A:
Q: A random sample of 14 married couples had their heights measured with the following results (X=man's…
A: Use Excel or any other software to draw the scatterplot.Steps of Excel:1. Enter the data.2. Go to…
Q: How many scores are in the population?
A: here given, SS = 328 variance = σ2 = 8
Q: The following data represent the boxplot and quartiles to decide if 0.89 0.90 0.93 0.94 0 93 0 92 0…
A: The correct answer is C. The following procedure is used to construct a box plot, Enter the data…
Q: A boxplot for a set of 28 scores is given below. 6 7 9 10 11 12 13 DATA How many scores are…
A:
Q: Q2: The Bureau of Meteorology of the Australian Government provided the mean annual rainfall in…
A:
Q: Estimate the number of students who get more than 48 but not more than 50 marks from the following…
A:
Q: 4) Give the five-number summary of the data shown in the boxplot below: 50 60 70 80
A: Boxplot is one of the graphical methods that is drawn for the quantitative variable to explain the…
Q: Determine the test score of John in Statistics if he has a z-score of 1.89. (SD = 4, mean = 82)
A:
Q: What would it be for the histogram box?
A: Graphs are used to represent the data in visual form. Each graph used for different purposes and…
Q: Find the mode of the following set of scores. 14 11 15 9 11 15 11 7 13 12
A: Ans- Find the mode of the following set of scores. 14 ,11, 15 ,9 ,11,15, 11, 7, 13, 12
Q: The following data set outlines the scores students had on an Algebra test. 40 40 41 41 41 41 42 43…
A: What is frequency ? In statistics , the frequency of an event is the number of times an observation…
Q: Find the estimated standard error for the sample mean for n = 27 and SS= 3505. Round to the nearest…
A: We have given that n = 27 and SS= 3505 The formula to find estimated standard error for the sample…
Q: 24. Estimate the number of students who get more than 48 but not more than 50 marks from the…
A:
Q: e. What is the highest personal messaging frequency among the bottom 20% of employees in terms of…
A: We have to find the values for normal distribution using CLT.
Q: Determine the test score of John in Statistics if he has a z-score of 1.9. (SD = 4, mean = 85)
A: Given that in statistics, John has z-score of 1.9 where mean score is 85 and SD is 4. Here, to find…
Q: The following data represents the ages of 40 emplovees in one of the
A: Arrange the given values in ascending order: 19, 19, 20, 21, 22, 22, 22, 22, 22, 22, 23, 24, 24, 24,…
Q: (d) What percentage of GMAT scores are between 447 and 747?
A: We have to find out given probabiity..
Q: 2.3 14.8 Percentile of 0.9 = (Round to the nearest whole number as needed.) :公
A: Given Total number of values = 50
Q: The scores on a statewide math exam were normally distributed with ?=74 and ?=8. What proportion of…
A: GivenMean(μ)=74standard deviation(σ)=8
Q: Find the population mean or sample mean as indicated. Population: 6, 9, 3, 12, 14, 16 O A. x= 11 В.…
A: we have to find correct option for given data..
Q: 2. Consider the foot length and foot width of six female grade 4 students in Morning Star Montessori…
A:

Step by step
Solved in 3 steps with 3 images
