2. For a population with u = 40 and o = 5, c following X values: %3D a. X=41 z= b. X=47 C. X=33 z= d. X= 28
2. For a population with u = 40 and o = 5, c following X values: %3D a. X=41 z= b. X=47 C. X=33 z= d. X= 28

Algebra & Trigonometry with Analytic Geometry
13th Edition
ISBN:9781133382119
Author:Swokowski
Publisher:Swokowski
Chapter10: Sequences, Series, And Probability
Section10.8: Probability
Problem 32E

Related questions

Question
Transcribed Image Text:021 - Compatibility Mode - Word
O Search
erences
Mailings
Review
View
Help
Aa v A
三E T
AABBCCL AaBbC AaBbCcl AaBbCcl AaBbCcD AaB
田、
Emphasis
Heading 1
1 Normal
Strong
Subtitle
Title
Paragraph
Styles
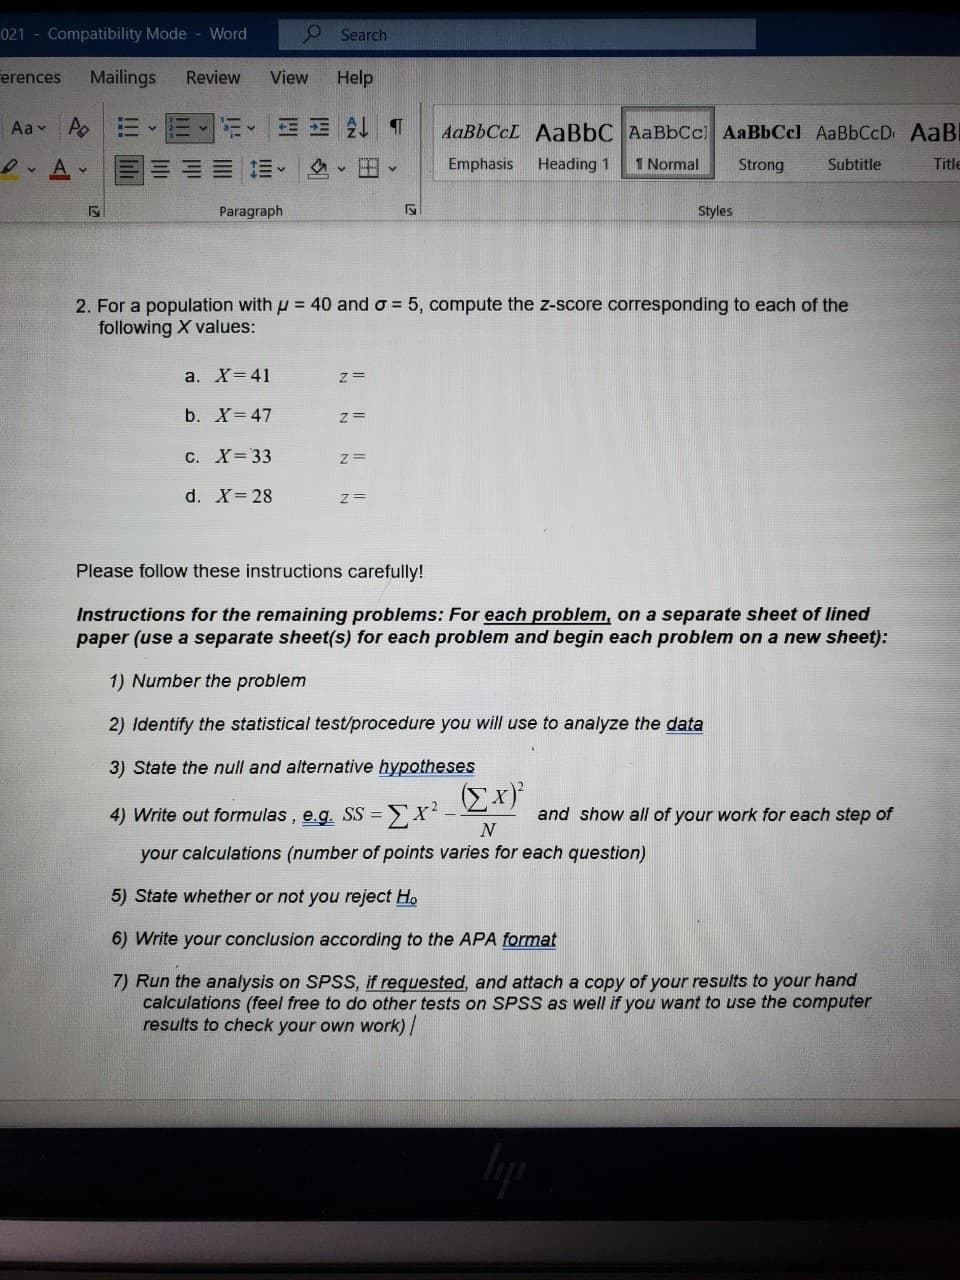
2. For a population with u = 40 and o = 5, compute the z-score corresponding to each of the
following X values:
a. X=41
z=
b. X=47
z=
C. X= 33
d. X=28
Please follow these instructions carefully!
Instructions for the remaining problems: For each problem, on a separate sheet of lined
paper (use a separate sheet(s) for each problem and begin each problem on a new sheet):
1) Number the problem
2) Identify the statistical test/procedure you will use to analyze the data
3) State the null and alternative hypotheses
4) Write out formulas , e.g. SS =
and show all of your work for each step of
your calculations (number of points varies for each question)
5) State whether or not you reject Ho
6) Write your conclusion according to the APA format
7) Run the analysis on SPSS, if requested, and attach a copy of your results to your hand
calculations (feel free to do other tests on SPSS as well if you want to use the computer
results to check your own work)
Expert Solution
This question has been solved!
Explore an expertly crafted, step-by-step solution for a thorough understanding of key concepts.

This is a popular solution!

Trending now
This is a popular solution!

Step by step
Solved in 2 steps

Knowledge Booster


Learn more about
Need a deep-dive on the concept behind this application? Look no further. Learn more about this topic, statistics and related others by exploring similar questions and additional content below.Recommended textbooks for you
Algebra & Trigonometry with Analytic Geometry
Algebra
ISBN:
9781133382119
Author:
Swokowski
Publisher:
Cengage
Algebra & Trigonometry with Analytic Geometry
Algebra
ISBN:
9781133382119
Author:
Swokowski
Publisher:
Cengage