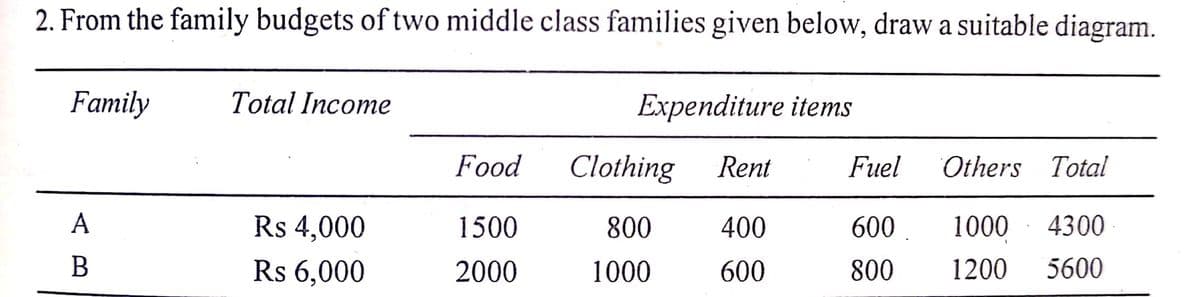
2. From the family budgets of two middle class families given below, draw a suitable diagram. Family Total Income Expenditure items Food Clothing Rent Fuel Others Total A Rs 4,000 1500 800 400 600. 1000 4300 В Rs 6,000 2000 1000 600 800 1200 5600


Q: "Jse Dataset4, which is posted in Data Sets in Bb. The purpose of the anlysis is to predict Income…
A: Confidence interval are used to estimate the range where the true parameter lies. If the confidence…
Q: Lecture(12.6b): Resaerchers were interested in the effects of maternal stress on infants…
A: Given that Researchers were interested in the effects of maternal stress on infants production of…
Q: them
A: By applying the ANOVA test for a single factor, 1.Null and alternative hypothesis: Ho: µ1 = µ2 =…
Q: question 1 a)List the basic requirement for the t-test b) Explain the relationship between two…
A:
Q: Value of home and life span are two variables that have been shown to have positive correlation but…
A: Given data value of home and lifespan are two variables that has positive correlation.
Q: A study was made on the amount of converted sugar in a certain process at various temperatures. The…
A:
Q: Topic: Plywood Manufacturing A product engineer wants to optimize the cutting of strips of wood,…
A: 1) The objective is to test whether there is a significant difference in mean of torque force for…
Q: Exercise 6.5 Consider a fully discrete 10-year term insurance issued to a select life aged 50, with…
A: Given Insurance type : Term insurance Age : 50 years Sum insured : $100000…
Q: The table shows survey data from 15 employees on their job satisfaction and (a) relationship with…
A: The dependent variable is Job satisfaction. The independent variable is Relationship with…
Q: Use the accompanying data set to complete the following actions. a. Find the quartiles. b. Find the…
A:
Q: A multiple regression analysis produced the following tables. Summary Output…
A: The level of significance is 0.10.
Q: Consider the following training set for a regression task. Length Width Output 25 25 120 15 30 95 20…
A: Consider the following regression model with intercept term: Ynx1=Xnxpβpx1+εnx1 where Y = Dependent…
Q: A random sample of the costs of repair jobs at a large muffler repair shop produces a mean of…
A: Obtain the 90% confidence interval for the average cost of a repair at this repair shop. The 90%…
Q: From the following observations, relating to the number of seeds germinated out of 10 seeds on damp…
A:
Q: Consider the following training set for a regression task. Length Width Output 25 25 120 15 30 95 20…
A: Let us consider a linear regression model with an intercept term: Y=β0+β1X+ε where Ynx1= Dependent…
Q: D. Using a 0.05 level of significance, test the hypothesis that there is no significant linear…
A: For the given data Find
Q: You are studying a new medication for chronic headaches. For each patient, you measure the…
A:
Q: Activity 2 A. Solving for the sampling distribution of its means. Answer the following problems. 1.…
A:
Q: Q1 Let X and Y be independent exponential random variables with rates A and µ respectively where A >…
A: Given λ>μ Find 1,2,3,4 parts
Q: A project has four activities (A, B, C, and D) that must be performed sequentially. The probability…
A:
Q: The following table gives the expected and observed frequencies of 4096 throws of 12 coins. Compare…
A:
Q: Example 1 Following data represents height and weight of a person at various age. Represent…
A:
Q: A newspaper poll found that 52 percent of the respondents in a large random sample of likely voters…
A: We have given that the 95% confidence interval for the population proportion was computed to be 0.52…
Q: ustration 9.14. Obtain the median size of shoes sold from the following data. TABLE 9.14. NUMBER OF…
A: Data given x Frequency (f) cf 5 30 30 5.5 40 70 6 50 120 6.5 150 270 7 300 570 7.5…
Q: Calculate the range, population variance, and population standard deviation for the following data…
A: We have given that, The data set are, 9,4,9,3,4,4,8,4,9,29 Then, We will find the range, variance…
Q: construct a 5 step hypothesis testing, and pls answer the type of test
A: From the given information, Choices Frequency Percentage 1 0 0% 2 0 0% 3 2 11.8% 4 6…
Q: The fraction of defective integrated circuits produced in a photolithography process is being…
A:
Q: You may need to use the appropriate technology to answer this question. Consider the data. 2. 9. 13…
A: The independent variable is x. The dependent variable is y. We have to test whether there is a…
Q: The number of motorcycles sold annually by salespeople is normally distributed with a standard…
A: From the provided information, Population standard deviation (σ) = 15 Sample size (n) = 300 Sample…
Q: •.• $6.10 A process that is considered to be in control measures an ingredient in ounces. Below are…
A:
Q: Sample 1 Assume that both populations are normally distributed. a) Test whether u, >H, at the a=…
A: Solution-: Given: n1=20,n2=12,x1¯=47.5,x2¯=37.6,s1=6.9,s2=9,α=0.05 We want to (a) Test whether…
Q: A kid’s box contains 36 broken B toys and 23 good G toys. The parents plan to donate 18 toys of…
A:
Q: 1. The grades on a chemistry midterm at Springer are roughly symmetric with e-67, and o-2. William…
A: Given that. X~N( μ , ?^2 ) μ=67 , ?=2 , x=65 Z-score =( x - μ )/?
Q: Q2: The number of stories in the 10 tallest buildings for two different cities is listed below.…
A: For determining the more variability in the number of stories between the specified cities, the…
Q: The weekly amount of money spent on maintenance and repairs by a company was observed, over a long…
A: Given that, the weekly amount of money spent on maintenance and repairs by a company was observed,…
Q: Assume that both populations are normally distributed. a) Test whether u, #H, at the a= 0.05 level…
A: Given that Sample Mean 1 (\bar X_1)(Xˉ1) = 1313 Sample Standard Deviation 1 (s_1)(s1) =…
Q: Let X and Y be two random variables with joint density function give. f(r, y) = 105xr*(1 –…
A: Solution
Q: B. Find the mean, standard deviation of the sampling distribution of the means. You may use the…
A: According to bartleby policy I have solved first three subparts of this question
Q: 2. In the Iditarod sled dog race, which of the following represents how many possible ways the…
A: Given that, 2. We need to find, in how many possible ways the racers can finish 1st, 2nd, and 3…
Q: Interview at least 40 random persons about their preference for shopping online and whether they…
A: Given the sample data of 40 persons about their preference for shopping online and whether they…
Q: A study was made on the amount of converted sugar in a certain process at various temperatures. The…
A:
Q: E-cigare Lettery-operated devices that can deliver nicotine and other chemicals in water instead of…
A: (a) From the given data, at 6 months verified abstinence was 7.3% (21 of 289) with nicotine…
Q: Question 8 The proportion of explained variance in a multiple regression is equal to 0.19. What is…
A:
Q: 1. Let A and B be two events such that P(A) = 0.4, P(B) = 0.7, P(A U B) = 0.9 a) Find P(A N B). b)…
A: The probability of an event gives the chances of occurrence of the event. The value of the…
Q: Let X and Y be two random variables with joint density function given by: f(x, y) = 105x*(1 –…
A:
Q: 4. Answer the following. Feel free to use the Excel Demo from the course website called "alpha and…
A: We need to answer the questions based on logical reasoning
Q: Fit the exponential trend for the following data and find the trend values Year : 1958 1968 1978…
A:
Q: The following regression equation for predicting exam score (Y) is given: Ý = 40.1 + 2.5 (number of…
A:
Q: Research conducts a study to identify the relationship between gender (1=male; 2=female) and emotion…
A: Given that Research conducts a study to identify the relationship between gender (1=male; 2=female)…
Q: d) An ELT is randomly selected and tested. If the test indicates that the ELT is defective, find the…
A: Let us define some events A : an ELT is manufactured by Altigauge company. B : an ELT is…

Step by step
Solved in 2 steps with 2 images

- Answer the following questions. 5. What is the term for the arrangement that selects r objects from a set of ii objects when the order of the r objects is not important? What is the formula for calculating the number of possible outcomes for this type of arrangement?The following table presents prices, in thousands of dollars, of single-family homes for 20 of the largest metropolitan areas in the United States for the first quarter of 2012 and the first quarter of 2013. . Metro Area 2012 2013 Boston, MA 311.5 332.2 Chicago, IL 157.2 159.4 Cincinnati, OH 112.5 121.0 Cleveland, OH 84.9 101.0 Dallas, TX 148.2 160.4 Denver, CO 226.4 261.2 Houston, TX 152.1 163.7 Los Angeles, CA 122.1 155.1 Miami, FL 182.0 219.9 Minneapolis, MN 147.3 170.6 Metro Area 2012 2013 New York, NY 363.8 368.2 Philadelphia, PA 193.5 197.7 Phoenix, AZ 129.9 169.0 Portland, OR 208.6 246.5 Riverside, CA 174.3 216.7 St. Louis, MO 103.7 111.0 San Diego, CA 359.5 412.3 San Francisco, CA 448.0…Data on the gasoline tax per gallon (in cents) as of a certain date for the 50 U.S. states and the District of Columbia are shown below. State Gasoline Taxper Gallon State Gasoline Taxper Gallon Alabama 19.1 Missouri 17.2 Alaska 9.1 Montana 27.7 Arizona 19.1 Nebraska 27.8 Arkansas 21.7 Nevada 23.7 California 37.1 New Hampshire 23.9 Colorado 23.4 New Jersey 14.5 Connecticut 25.1 New Mexico 19.0 Delaware 22.9 New York 33.9 District of Columbia 23.4 North Carolina 35.4 North Dakota 23.1 Florida 30.7 Ohio 28.1 Georgia 26.6 Oklahoma 17.1 Hawaii 18.4 Oregon 30.1 Idaho 33.1 Pennsylvania 51.3 Illinois 33.0 Rhode Island 34.0 Indiana 28.9 South Carolina 16.9 Iowa 31.9 South Dakota 30.1 Kansas 24.9 Tennessee 21.3 Kentucky 25.9 Texas 20.1 Louisiana 21.0 Utah 30.0 Maine 31.5 Vermont 30.6 Maryland 32.7 Virginia 16.9 Massachusetts 26.6 Washington 44.5 Michigan 31.0 West Virginia 33.3 Minnesota 30.5 Wisconsin 33.0 Mississippi 18.3 Wyoming 24.1…
- Data on the gasoline tax per gallon (in cents) as of a certain date for the 50 U.S. states and the District of Columbia are shown below. State Gasoline Taxper Gallon State Gasoline Taxper Gallon Alabama 19.1 Missouri 17.4 Alaska 8.9 Montana 27.9 Arizona 19.1 Nebraska 27.8 Arkansas 21.7 Nevada 23.9 California 37.3 New Hampshire 23.9 Colorado 23.2 New Jersey 14.5 Connecticut 24.9 New Mexico 19.0 Delaware 22.9 New York 33.9 District ofColumbia 23.4 North Carolina 35.2 North Dakota 22.9 Florida 30.7 Ohio 27.9 Georgia 26.6 Oklahoma 17.1 Hawaii 18.4 Oregon 30.1 Idaho 33.1 Pennsylvania 51.5 Illinois 33.0 Rhode Island 34.0 Indiana 28.9 South Carolina 16.9 Iowa 31.7 South Dakota 30.1 Kansas 24.9 Tennessee 21.3 Kentucky 25.9 Texas 20.1 Louisiana 20.8 Utah 30.2 Maine 31.5 Vermont 30.6 Maryland 32.9 Virginia 16.9 Massachusetts 26.6 Washington 44.7 Michigan 31.0 West Virginia 33.1 Minnesota 30.7 Wisconsin 32.8 Mississippi 18.3 Wyoming 24.1 (a) The smallest value in the data set is 8.9 (Alaska) and…In Delphi, there are three processing plants. The pay information for the representatives of these production lines is as per the following: No.of Employees Average income Total income Factory A 100 $8000 $800000 Factory B 80 $5000 $400000 Factory C 20 $20000 $400000 What is the normal pay of the assembly line laborers of Delphi?The table below contains the total cost ($) for four tickets to a basketball game purchased on the secondary market, two beers, two soft drinks, two hot dogs, and one parking space at each arena during a recent season. 215.02 224.58 224.43 215.97 203.04 287.43 261.25 214.76 395.96 317.13 301.05 370.49 310.61 319.41 319.33 420.73 420.32 481.66 484.87 430.76 411.28 543.08 566.08 535.56 532.38 619.08 727.78 766.28 791.92 897.06 a. Organize these costs as an ordered array. b. Construct a frequency distribution and a percentage distribution for these costs. c. Around what values, if any, are at least 75% of the costs of attending the game concentrated? Explain. At least 75% of the costs of attending a game are concentrated around the class groupings "$200 but less than $400" and "$500 but less than $700." B. At least 75% of…