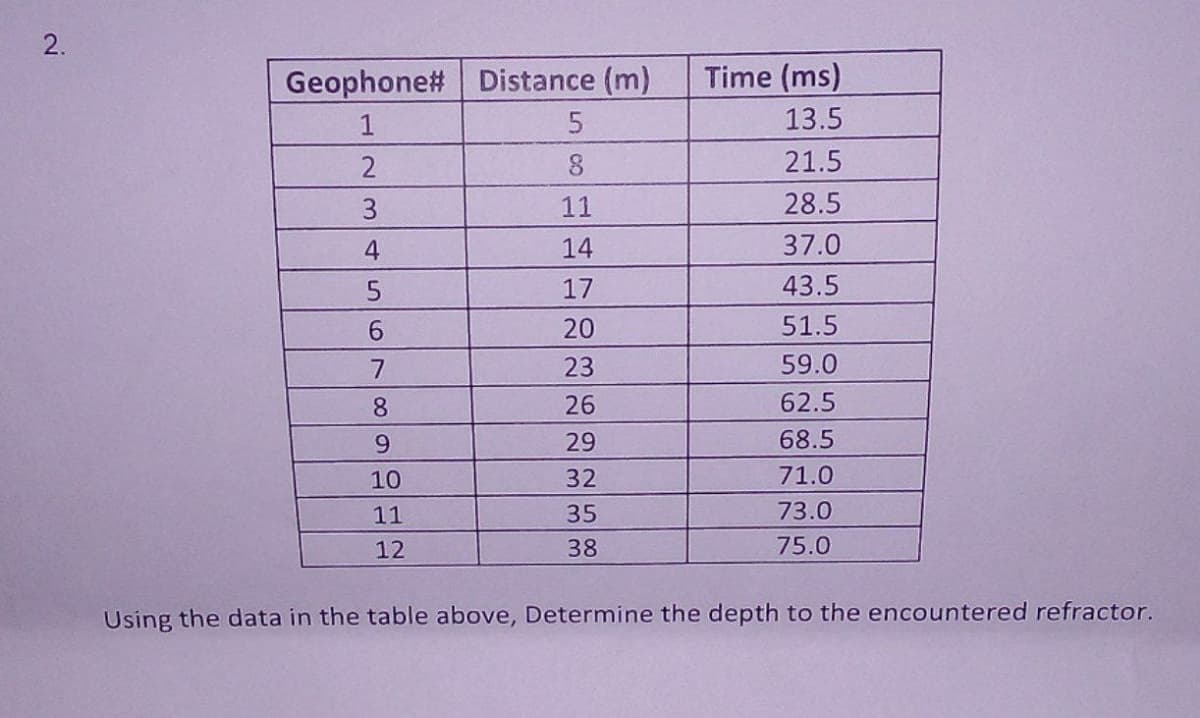
Geophone# Distance (m) Time (ms) 1 13.5 21.5 3. 11 28.5 4 14 37.0 17 43.5 6. 20 51.5 7 23 59.0 8. 26 62.5 9. 29 68.5 10 32 71.0 11 35 73.0 12 38 75.0 Using the data in the table above, Determine the depth to the encountered refractor.


Q: Fuming because you are stuck in traffic? Roadway congestion is a costly item, both in time wasted…
A: And the given relationships are verified using graphing calculator as follows
Q: The red blood cell count of a healthy person was measured on each of15 days.
A: a).The histogram is an appropriate graph to visualise one quantitative variable.Step-by-step…
Q: Earthquakes Refer to Data Set 21 “Earthquakes" O in Appendix B O and use the depths (x) and…
A: 34 Step-by-step procedure to obtain the regression using the Excel: Enter the data for x and y…
Q: Make explonatory variable ano! Final os the scotter plot of the data with Pre os the and! epponse…
A: When we have a bivariate data i.e data like (X,Y) then we make scatter plot to represent the…
Q: H.W//1 The dimensions of the rectangular tank shown down are measured as L= 40.00 ft W = 20.00 ft H…
A: Given dimensions of a rectangular tank. To find the volume and standard deviation in the volume.
Q: The box-and-whisker plot shows the ages of employees at a local company Employee Ages Years What is…
A: The summary statistics that can be seen using boxplot is shown below:
Q: The data represents the heights of eruptions by a geyser. Use the heights to construct a stemplot.…
A:
Q: Use the histogram to answer the questions. Frequency Choose which shape best describes the data.…
A:
Q: Determine which of the following describes qualitative data. i). the volume of a shipping container,…
A: here we know that shape and name comes under qualitative data, 1- volume of the container does not…
Q: Unit 4, Lesson 7: Areas under à Nörmal Curve Dseiny Olaaghu How many data points are presented in…
A:
Q: Use a calculator or computer software to generate a normal quantile plot for the data in the…
A: Given: Duration 332 131 296 48 27 384 216 136 248 419 55 202 100…
Q: e distance (in miles) from an airport of a sample of 22 inbound and outbound airplanes set's first,…
A: The formulas for quartiles is,
Q: An engineer who accidentally inhaled poisonous fumes was given treatment for it. The concentration…
A: Let us solve the given question by method of least square in the next steps.
Q: Which would be considered Qualitative data? a) A list of the measure of the diameters for each tire…
A:
Q: Determine the level of measurement of the variable in parts a and b below a. The medal received…
A: a) It is given that the variable is the medal received (gold, silver, bronze) by an Olympic gymnast.
Q: A baseball is thrown upward, and its height measured at 0.5-second intervals using a strobe light.…
A: Given data is Time (s) Height (feet) 0 4.2 0.5 26.1 1.0 40.1 1.5 46.0 2.0 43.9 2.5…
Q: A sample of 10 people ingested a new formulation of a new drug. Six hours later, the concentrations…
A: Dot plot:It is a variation in bar chart in which dots are used instead of bars to represent the…
Q: The calcium (Ca) content of a powdered mineral substance was analyzed 10 times with the following…
A: Given that,0.271 0.282 0.279 0.281 0.2680.271 0.281 0.269 0.275 0.276
Q: Weotherwise is a magazine published by the American Mctcorological Socicty. One issue gives a rating…
A: Determine the level of significance. Significance level: In order to decide how small the p-value…
Q: 6. Maximum breath of samples of male Egyptian skulls from 4000 BC and from 150 AD is listed. Make a…
A: The range for the X axis are, 119, 119+3=122, 122+3=125, 125+3=128, 128+3=131, 131+3=134, 134+3=137,…
Q: A baseball is thrown upward, and its height measured at 0.5-second intervals using a strobe light.…
A: Given that, A baseball is thrown upward, and its height is measured at 0.5-second intervals using…
Q: + | 8 O 3/ 3 100% Temalese 20 O Male crabs A Female crabs 80 o DD OO 00 35 40 45 50 25 30 Carapace…
A: Here the two variables are Rear width and Carapace width of crabs measured in mm. As width is given…
Q: a) Calculate the average time per lap (in s) for student 2. b) Calculate the uncertainty (ie.…
A: Given data is appropraite for measures of central tendency and measures of dispersion.
Q: NA MS IV) Variance V = d;?+d;?+. .+d,2 =0.575 6-1 O-575 n- MA V=0.115 n AL d;? x di Diis 0. 02a5 IA…
A: Given: 12.812.212.513.112.912.4
Q: The following data represent the results obtained from the specific gravity (S.G.) test performed in…
A: Mode is defined as the observation that occurs the maximum number of times, i.e, the observation…
Q: homes sold in Newburg Park in the past year. The data are plotted in the scatter plot in Figure 1.…
A: In the bivariate distribution (xi,yi),(i=1,2,...,n), let Y be the dependent variable and X be the…
Q: 3. James Short (1708–1768), a Scottish optician, constructed the highest-quality reflectors of his…
A: Given Information : James Short (1708 - 1768) , a Scottish optician , constructed the highest…
Q: Can you help me with sections 3 and 4?
A: 3.Each of the given measures are located and marked on the graph paper as shown below:
Q: 3. The following stem-and-leaf plot gives the midterm exam scores for a statistics class. 14 3 4 5…
A: Stem-and-leaf plot:A graphical representation of the quantitative data in which each data entry is…
Q: What type of data is this? a) The first, second and third person in a competition. Letter grades: A,…
A: Hi! Thank you for the question, As per the honor code, we are allowed to answer three sub-parts at a…
Q: X coordinate Y coordinate Weight| 60 80 4 45 45 5 70 60 6. 55 60 7 65 75 4 70 45 3 80 60 45 75 30 70…
A: Hi! Thank you for the question, As per the honor code, we are allowed to answer three sub-parts at a…
Q: Classify the data as either discrete or continuous. The average speed of cars passing a busy…
A:
Q: The histogram and cumdative percentage polygon below viaualize the property taves per capita for 60…
A: Given data: The histogram and cumulative percentage polygon below visualize the property taxes per…
Q: Sheet 2 (Home Size): In a given community, a survey was conducted to determine - whether there is…
A: The provided information is x y xy x2 41.2 2.9 119.48 1697.44 68.3 3.5 239.05 4664.89 22.4…
Q: What kind of data is "distance in km"?
A: Given: Distance in kilometres then identify what kind of data is distance in km .?
Q: Fisher and van Belle (1993) report mortality rates due to malignant melanoma of the skin for white…
A: Correlation coefficient quantifies the strength and direction of the relationship between variables.…
Q: Are cigarettes bad for people? Cigarette smoking involves tar, carbon monoxide, and nicotine…
A: Steps for Stem-and-leaf diagram: In stem plot each of the observation is separated into two parts,…
Q: Q.3. The annual precipitation data (mm) recorded at Kumköy, Istanbul in period 1952-1990 are given…
A: Hello. Since your question has multiple sub-parts, we will solve first three sub-parts for you. If…
Q: Complete parts (a) through (e) below (a) Determine the crtical valuets) for a right-taled test of a…
A: Crit values are computed using t-table
Q: b) Put a cross in the box to identify the type of data [COPY THIS TABLE IN THE ANSWER SHEET] 15…
A: "Here mention b part to be solve" Given : b) Two types of Data : 1. Quantitative : The data which…
Q: Q.3. The annual precipitation data (mm) recorded at Kumköy, Istanbul in period 1952-1990 are given…
A: Since you have posted a question with multiple sub-parts, we will solve first three subparts for…
Q: Oil field pipes are internally coated in order to prevent corrosion. Researchers investigated the…
A: Given data is:1.04, 1.55, 2.53, 2.29, 2.69, 1.62, 2.41, 1.74, 1.78, 2.71, 1.75, 2.91, 2.78, 1.89,…
Q: The depths (in inches) at which 10 artifacts are found are listed. Complete parts (a) and (b) below.…
A: given data in accending order 24.8,25.2,26.4,27.7,28.4,31.9,32.1,36.5,37.9,46.7
Q: The diameter of iron rods issued in a high rising building pillars are under investigation. The…
A: The data are given i) for the interquartile range first we calculate first quartile and third…
Q: We want to predict the selling price of a house in Newburg Park, Florida, based on the distance the…
A: Given: Sample size n = 15 Slope b = -4.73 Formula Used: Y-intercept a = ∑Y-b∑Xn Sample correlation…
Q: An ecologist hypothesizes a relationship between wing span of birds and the width of tree branches…
A: Given, Wing span Branch diameter 79.3 1.56 80.1 1.53 80.7 1.39 81.5 1.04 79.5 1.39…
Q: 3. Load the Santa Barbara temperature data using the following com- mands…
A: Answer: An even additional explicit example is that the l ink that exists between the fields of…
Q: Which of the following is (are) TRUE about the arcsine transformation? It is used for percentage…
A: “Since you have posted a question with multiple sub-parts, we will solve first three sub-parts for…


Trending now
This is a popular solution!

Step by step
Solved in 2 steps with 2 images

- Running Speed A man is running around a circular track that is 200 m in circumference. An observer uses a stopwatch to record the runners time at the end of each lap, obtaining the data in the following table. aWhat was the mans average speed rate between 68 s and 152 s? bWhat was the mans average speed between 263 s and 412 s? cCalculate the mans speed for each lap. Is he slowing down, speeding up or neither? Time s Distance m 32 200 68 400 108 600 152 800 203 1000 263 1200 335 1400 412 1600Running Speed A man is running around a circular track that is 200 m in circumference. An observer uses a stopwatch to record the runner’s time at the each of each lap, obtaining the data in the following table. (a) What was the man’s average speed (rate) between 68 s and 152 s? (b) What was the man’s average speed between 263 s and 412 s? (c) Calculate the man’s speed for cadi lap, Is he slowing down, speeding up, or neither?Please to perform in excel and show formulas. the exercise is in the images as well -------------------- The data shown in Table 6E.2 are x and R values for 24 samples of size n = 5 taken from a process producing bearings. The measurements are made on the inside diameter of the bearing, with only the last threedecimals recorded (i.e., 34.5 should be 0.50345). (a) Set up x and R charts on this process. Does the process seem to be in statistical control? If necessary, revise the trial control limits (b) If specifications on this diameter are 0.5030 ± 0.0010, find the percentage of nonconforming bearings produced by this process. Assume that diameter is normally distributed
- Find the indicated IQ score. The graph to the right depicts IQ scores of adults, and those scores are normally distributed with a mean of 100 and a standard deviation of 15. A symmetric bell-shaped curve is plotted over a horizontal scale. A vertical line runs from the scale to the curve at labeled coordinate x, which is to the right of the curve’s center and peak. The area under the curve to the right of the vertical line is shaded and labeled 0.1931.The indicated IQ score isAssume that a randomly selected subject is given a bone density test. Those test scores are normally distributed with a mean of 0 and a standard deviation of 1. Draw a graph and find the probability of a bone density test score greater than negative 1.91−1.91. Question content area bottom Part 1 Sketch the region. Choose the correct graph below. A. -1.91 A symmetric bell-shaped curve is plotted over a horizontal axis. A vertical line segment runs from the horizontal axis to the curve at labeled coordinate negative 1.91, which is to the left of the curve’s center and peak. The area under the curve to the right of negative 1.91 is shaded. B. -1.91 A symmetric bell-shaped curve is plotted over a horizontal axis. A vertical line segment runs from the horizontal axis to the curve at labeled coordinate negative 1.91, which is to the left of the curve’s center and peak. The area under the curve to the left…Using the table, How to find the sensitivity and specificity with the formulas Pr(X = + | Y = +) and Pr(X = - | Y = -) using excel?
- Speedometer readings for a motorcycle at 12-second intervals are given in the table. Give another estimate (in feet) using the velocities at the end of the time periods.Find the indicated IQ score. The graph to the right depicts IQ scores of adults, and those scores are normally distributed with a mean of 100 and a standard deviation of 15. x 0.3694 A symmetric bell-shaped curve is plotted over a horizontal scale. A vertical line runs from the scale to the curve at labeled coordinate x, which is to the right of the curve’s center and peak. The area under the curve to the right of the vertical line is shaded and labeled 0.3694. The indicated IQ score is enter your response here. (Round to the nearest whole number as needed.)The expression of Absorption's law is given by what?
- A sinusoidal voltage v = 100 sin(wt) volts. Use integration to determine over half cyclei. The mean value ii. The r.m.s valueAssume that a randomly selected subject is given a bone density test. Those test scores are normally distributed with a mean of 0 and a standard deviation of 1. Find the probability that a given score is less than −1.93 and draw a sketch of the region.Question content area bottomPart 1Sketch the region. Choose the correct graph below.A.-1.93 A symmetric bell-shaped curve is plotted over a horizontal scale. A vertical line runs from the scale to the curve at labeled coordinate negative 1.93, which is to the left of the curve’s center and peak. The area under the curve to the left of the vertical line is shaded.B.1.93 A symmetric bell-shaped curve is plotted over a horizontal scale. A vertical line runs from the scale to the curve at labeled coordinate 1.93, which is to the right of the curve’s center and peak. The area under the curve to the left of the vertical line is shaded.C.1.93-1.93 A symmetric bell-shaped curve is plotted over a horizontal scale. Two vertical lines run from…medical researcher says that less than 79% of adults in a certain country think that healthy children should be required to be vaccinated. In a random sample of 200 adults in that country, 75% think that healthy children should be required te vaccinated. At a=0.01, is there enough evidence to support the researcher's claim? Complete parts (a) through (e) below. (b) Find the critical value(s) and identify the rejection region(s). Identify the critical value(s) for this test (Round to two decimal places as needed. Use a comma to separate answers as needed.) Identify the rejection region(s). Select the correct choice below and fill in the answer box(es) to complete your choice. (Round to two decimal places as needed.) O A. The rejection region is z>. O B. The rejection regions are z< and z> O C. The rejection region is <z< O D. The rejection region is z< (C) Find the standardized test statistic z. (Round to two decimal places as needed.) (d) Decide whether to reject or…


