Q.3. The annual precipitation data (mm) recorded at Kumköy, Istanbul in period 1952-1990 are given below: 661 676 555 892 679 556 760 716 585 733 867 893 520 913 648 639 908 707 696 725 675 748 893 1139 815 685 907 932 919 1230 720 658 737 837 731 1046 926 471 763 a) Plot the histogram and frequency histogram dividing the data into six equal class in tervals of equal length (109 mm). b) Plot the cumulative frequency distributions. Estimate the parameters for the central value of the annual precipitation.
Q.3. The annual precipitation data (mm) recorded at Kumköy, Istanbul in period 1952-1990 are given below: 661 676 555 892 679 556 760 716 585 733 867 893 520 913 648 639 908 707 696 725 675 748 893 1139 815 685 907 932 919 1230 720 658 737 837 731 1046 926 471 763 a) Plot the histogram and frequency histogram dividing the data into six equal class in tervals of equal length (109 mm). b) Plot the cumulative frequency distributions. Estimate the parameters for the central value of the annual precipitation.

Functions and Change: A Modeling Approach to College Algebra (MindTap Course List)
6th Edition
ISBN:9781337111348
Author:Bruce Crauder, Benny Evans, Alan Noell
Publisher:Bruce Crauder, Benny Evans, Alan Noell
Chapter5: A Survey Of Other Common Functions
Section5.3: Modeling Data With Power Functions
Problem 6E: Urban Travel Times Population of cities and driving times are related, as shown in the accompanying...

Related questions
Topic Video
Question
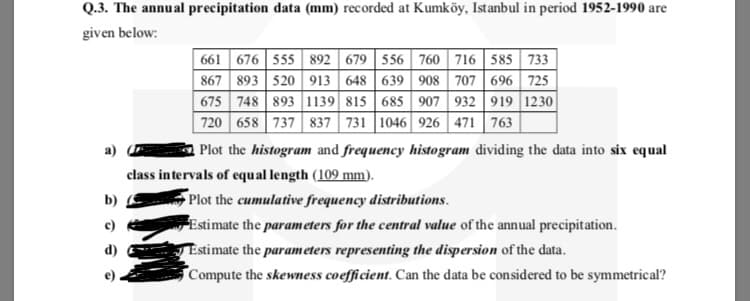
Transcribed Image Text:Q.3. The annual precipitation data (mm) recorded at Kumköy, Istanbul in period 1952-1990 are
given below:
661 676 555 892 679 556 760 716 585 733
867 893 520 913 648 639 908 707 696 725
675 748 893 1139 815 685 907 932 919 1230|
720 658 737 837 731 1046 926 471 763
a)
Plot the histogram and frequency histogram dividing the data into six equal
class intervals of equal length (109 mm).
Plot the cumulative frequency distributions.
Estimate the parameters for the central value of the annual precipitation.
b)
Estimate the parameters representing the dispersion of the data.
Compute the skewness coefficient. Can the data be considered to be symmetrical?
Expert Solution
This question has been solved!
Explore an expertly crafted, step-by-step solution for a thorough understanding of key concepts.

Step by step
Solved in 6 steps with 5 images

Knowledge Booster


Learn more about
Need a deep-dive on the concept behind this application? Look no further. Learn more about this topic, statistics and related others by exploring similar questions and additional content below.Recommended textbooks for you
Functions and Change: A Modeling Approach to Coll…
Algebra
ISBN:
9781337111348
Author:
Bruce Crauder, Benny Evans, Alan Noell
Publisher:
Cengage Learning
Functions and Change: A Modeling Approach to Coll…
Algebra
ISBN:
9781337111348
Author:
Bruce Crauder, Benny Evans, Alan Noell
Publisher:
Cengage Learning