2. In an ANOVA Summary Table, the following is/are true: a) mean squares are used to compute at statistic b) mean squares are used to compute a z statistic c) mean squares are used to compute an F statistic d) mean squares are used to compute degrees of freedom e) with knowledge of degrees of freedom, sums of squares can be computed from knowledge of mean squares f) p-values are used to evaluate the null hypothesis of equal sample means
2. In an ANOVA Summary Table, the following is/are true: a) mean squares are used to compute at statistic b) mean squares are used to compute a z statistic c) mean squares are used to compute an F statistic d) mean squares are used to compute degrees of freedom e) with knowledge of degrees of freedom, sums of squares can be computed from knowledge of mean squares f) p-values are used to evaluate the null hypothesis of equal sample means

College Algebra (MindTap Course List)
12th Edition
ISBN:9781305652231
Author:R. David Gustafson, Jeff Hughes
Publisher:R. David Gustafson, Jeff Hughes
Chapter8: Sequences, Series, And Probability
Section8.7: Probability
Problem 58E: What is meant by the sample space of an experiment?

Related questions

Topic Video
Question
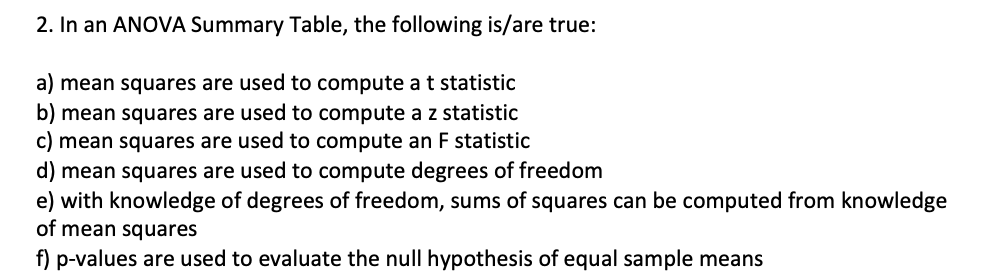
Transcribed Image Text:2. In an ANOVA Summary Table, the following is/are true:
a) mean squares are used to compute at statistic
b) mean squares are used to compute az statistic
c) mean squares are used to compute an F statistic
d) mean squares are used to compute degrees of freedom
e) with knowledge of degrees of freedom, sums of squares can be computed from knowledge
of mean squares
f) p-values are used to evaluate the null hypothesis of equal sample means
Expert Solution
This question has been solved!
Explore an expertly crafted, step-by-step solution for a thorough understanding of key concepts.

This is a popular solution!

Trending now
This is a popular solution!

Step by step
Solved in 2 steps with 3 images

Knowledge Booster


Learn more about
Need a deep-dive on the concept behind this application? Look no further. Learn more about this topic, statistics and related others by exploring similar questions and additional content below.Recommended textbooks for you
College Algebra (MindTap Course List)
Algebra
ISBN:
9781305652231
Author:
R. David Gustafson, Jeff Hughes
Publisher:
Cengage Learning

College Algebra (MindTap Course List)
Algebra
ISBN:
9781305652231
Author:
R. David Gustafson, Jeff Hughes
Publisher:
Cengage Learning