Fill in the missing values in the ANOVA tables below and answer the questions relating to each table and the provided plots. Df Sum Sq Mean Sq F-value p-value Group 2 27.159 7.2e-06 Residuals 94 189.58 Totals Table 1: Q9) ANOVA table. (a) How many treatment groups are there in this experiment and what was the total sample size? (b) What are Ho and HA relating to the F statistic in this table? (c) Let a = 0.001. Given the output of this table, what decision would you make about the hypotheses?
Fill in the missing values in the ANOVA tables below and answer the questions relating to each table and the provided plots. Df Sum Sq Mean Sq F-value p-value Group 2 27.159 7.2e-06 Residuals 94 189.58 Totals Table 1: Q9) ANOVA table. (a) How many treatment groups are there in this experiment and what was the total sample size? (b) What are Ho and HA relating to the F statistic in this table? (c) Let a = 0.001. Given the output of this table, what decision would you make about the hypotheses?

MATLAB: An Introduction with Applications
6th Edition
ISBN:9781119256830
Author:Amos Gilat
Publisher:Amos Gilat
Chapter1: Starting With Matlab
Section: Chapter Questions
Problem 1P

Related questions
Question
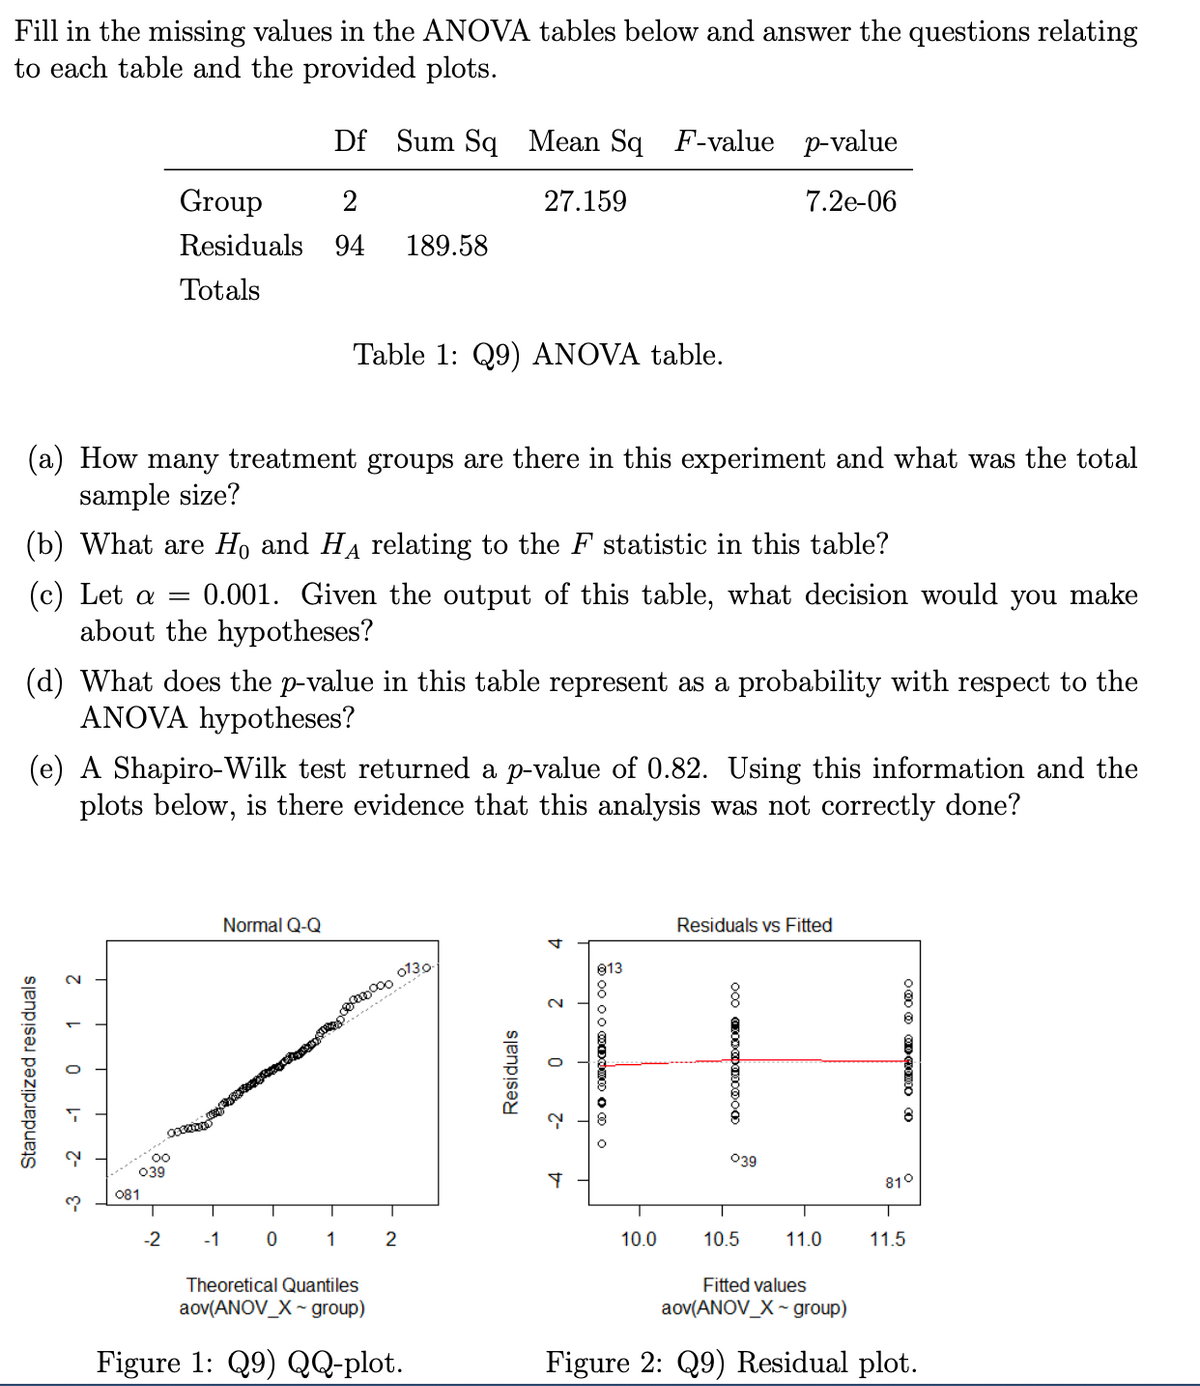
Transcribed Image Text:Fill in the missing values in the ANOVA tables below and answer the questions relating
to each table and the provided plots.
Df Sum Sq Mean Sq F-value p-value
Group
2
27.159
7.2e-06
Residuals 94
189.58
Totals
Table 1: Q9) ANOVA table.
(a) How many treatment groups are there in this experiment and what was the total
sample size?
(b) What are Ho and HA relating to the F statistic in this table?
(c) Let a =
0.001. Given the output of this table, what decision would you make
about the hypotheses?
(d) What does the p-value in this table represent as a probability with respect to the
ANOVA hypotheses?
(e) A Shapiro-Wilk test returned a p-value of 0.82. Using this information and the
plots below, is there evidence that this analysis was not correctly done?
Normal Q-Q
Residuals vs Fitted
0130
813
....
00
039
039
081
T
81°
T
-2
-1
1
10.0
10.5
11.0
11.5
Theoretical Quantiles
Fitted values
aov(ANOV_X ~ group)
aov(ANOV_X ~ group)
Figure 1: Q9) QQ-plot.
Figure 2: Q9) Residual plot.
Standardized residuals
-2
E-
-1
1 2
Residuals
O 00 00 MDOD O O O
Expert Solution
This question has been solved!
Explore an expertly crafted, step-by-step solution for a thorough understanding of key concepts.

Step by step
Solved in 4 steps

Recommended textbooks for you
MATLAB: An Introduction with Applications
Statistics
ISBN:
9781119256830
Author:
Amos Gilat
Publisher:
John Wiley & Sons Inc

Probability and Statistics for Engineering and th…
Statistics
ISBN:
9781305251809
Author:
Jay L. Devore
Publisher:
Cengage Learning

Statistics for The Behavioral Sciences (MindTap C…
Statistics
ISBN:
9781305504912
Author:
Frederick J Gravetter, Larry B. Wallnau
Publisher:
Cengage Learning
MATLAB: An Introduction with Applications
Statistics
ISBN:
9781119256830
Author:
Amos Gilat
Publisher:
John Wiley & Sons Inc
Probability and Statistics for Engineering and th…
Statistics
ISBN:
9781305251809
Author:
Jay L. Devore
Publisher:
Cengage Learning
Statistics for The Behavioral Sciences (MindTap C…
Statistics
ISBN:
9781305504912
Author:
Frederick J Gravetter, Larry B. Wallnau
Publisher:
Cengage Learning

Elementary Statistics: Picturing the World (7th E…
Statistics
ISBN:
9780134683416
Author:
Ron Larson, Betsy Farber
Publisher:
PEARSON

The Basic Practice of Statistics
Statistics
ISBN:
9781319042578
Author:
David S. Moore, William I. Notz, Michael A. Fligner
Publisher:
W. H. Freeman

Introduction to the Practice of Statistics
Statistics
ISBN:
9781319013387
Author:
David S. Moore, George P. McCabe, Bruce A. Craig
Publisher:
W. H. Freeman