2. Normal Problem (Use info in Section 6-3.) Engineers must consider the widths of peoples' heads when designing face masks. Suppose men have head widths that are normally distributed with a mean of 6.125 inches and a standard deviation of 1.03 inches. a. If one male is randomly selected, find the probability that his head breadth is less than 6.5 inches. b. If a random sample of 25 males is selected, find the probability that the mean of their head breadths is less than 6.5 inches. c. Is there a difference in the two answers? Explain your answer statistically.
2. Normal Problem (Use info in Section 6-3.) Engineers must consider the widths of peoples' heads when designing face masks. Suppose men have head widths that are normally distributed with a mean of 6.125 inches and a standard deviation of 1.03 inches. a. If one male is randomly selected, find the probability that his head breadth is less than 6.5 inches. b. If a random sample of 25 males is selected, find the probability that the mean of their head breadths is less than 6.5 inches. c. Is there a difference in the two answers? Explain your answer statistically.

College Algebra
7th Edition
ISBN:9781305115545
Author:James Stewart, Lothar Redlin, Saleem Watson
Publisher:James Stewart, Lothar Redlin, Saleem Watson
Chapter9: Counting And Probability
Section9.3: Binomial Probability
Problem 40E: Telephone Marketing A mortgage company advertises its rates by making unsolicited telephone calls to...

Related questions
Question
Just question 2 please.
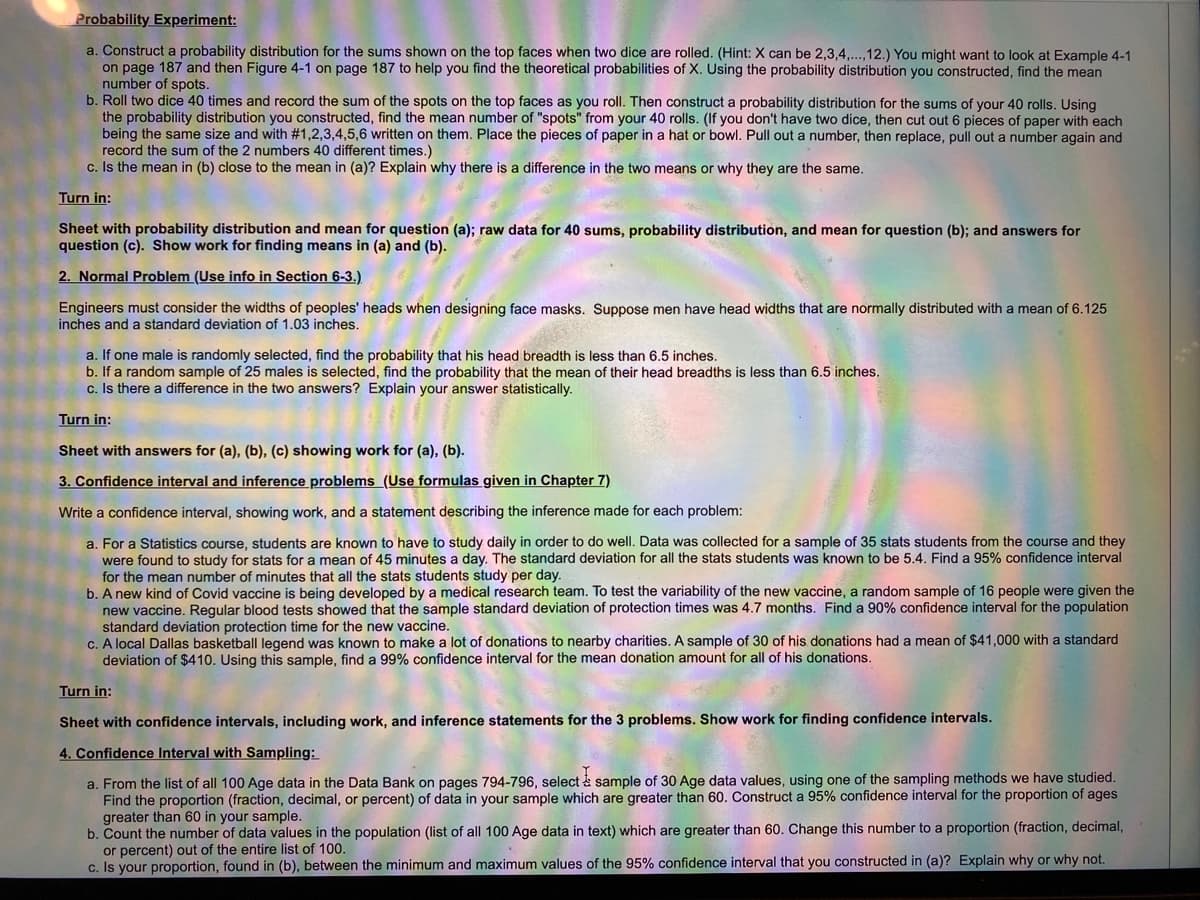
Transcribed Image Text:Probability Experiment:
a. Construct a probability distribution for the sums shown on the top faces when two dice are rolled. (Hint: X can be 2,3,4.,12.) You might want to look at Example 4-1
on page 187 and then Figure 4-1 on page 187 to help you find the theoretical probabilities of X. Using the probability distribution you constructed, find the mean
number of spots.
b. Roll two dice 40 times and record the sum of the spots on the top faces as you roll. Then construct a probability distribution for the sums of your 40 rolls. Using
the probability distribution you constructed, find the mean number of "spots" from your 40 rolls. (If you don't have two dice, then cut out 6 pieces of paper with each
being the same size and with #1,2,3,4,5,6 written on them. Place the pieces of paper in a hat or bowl. Pull out a number, then replace, pull out a number again and
record the sum of the 2 numbers 40 different times.)
c. Is the mean in (b) close to the mean in (a)? Explain why there is a difference in the two means or why they are the same.
Turn in:
Sheet with probability distribution and mean for question (a); raw data for 40 sums, probability distribution, and mean for question (b); and answers for
question (c). Show work for finding means in (a) and (b).
2. Normal Problem (Use info in Section 6-3.)
Engineers must consider the widths of peoples' heads when designing face masks. Suppose men have head widths that are normally distributed with a mean of 6.125
inches and a standard deviation of 1.03 inches.
a. If one male is randomly selected, find the probability that his head breadth is less than 6.5 inches.
b. If a random sample of 25 males is selected, find the probability that the mean of their head breadths is less than 6.5 inches.
c. Is there a difference in the two answers? Explain your answer statistically.
Turn in:
Sheet with answers for (a), (b), (c) showing work for (a), (b).
3. Confidence interval and inference problems_(Use formulas given in Chapter 7)
Write a confidence interval, showing work, and a statement describing the inference made for each problem:
a. For a Statistics course, students are known to have to study daily in order to do well. Data was collected for a sample of 35 stats students from the course and they
were found to study for stats for a mean of 45 minutes a day. The standard deviation for all the stats students was known to be 5.4. Find a 95% confidence interval
for the mean number of minutes that all the stats students study per day.
b. A new kind of Covid vaccine is being developed by a medical research team. To test the variability of the new vaccine, a random sample of 16 people were given the
new vaccine. Regular blood tests showed that the sample standard deviation of protection times was 4.7 months. Find a 90% confidence interval for the population
standard deviation protection time for the new vaccine.
c. A local Dallas basketball legend was known to make a lot of donations to nearby charities. A sample of 30 of his donations had a mean of $41,000 with a standard
deviation of $410. Using this sample, find a 99% confidence interval for the mean donation amount for all of his donations.
Turn in:
Sheet with confidence intervals, including work, and inference statements for the 3 problems. Show work for finding confidence intervals.
4. Confidence Interval with Sampling:
a. From the list of all 100 Age data in the Data Bank on pages 794-796, select & sample of 30 Age data values, using one of the sampling methods we have studied.
Find the proportion (fraction, decimal, or percent) of data in your sample which are greater than 60. Construct a 95% confidence interval for the proportion of ages
greater than 60 in your sample.
b. Count the number of data values in the population (list of all 100 Age data in text) which are greater than 60. Change this number to a proportion (fraction, decimal,
or percent) out of the entire list of 100.
c. Is your proportion, found in (b), between the minimum and maximum values of the 95% confidence interval that you constructed in (a)? Explain why or why not.
Expert Solution
This question has been solved!
Explore an expertly crafted, step-by-step solution for a thorough understanding of key concepts.

Step by step
Solved in 2 steps with 2 images

Recommended textbooks for you
College Algebra
Algebra
ISBN:
9781305115545
Author:
James Stewart, Lothar Redlin, Saleem Watson
Publisher:
Cengage Learning


Algebra and Trigonometry (MindTap Course List)
Algebra
ISBN:
9781305071742
Author:
James Stewart, Lothar Redlin, Saleem Watson
Publisher:
Cengage Learning
College Algebra
Algebra
ISBN:
9781305115545
Author:
James Stewart, Lothar Redlin, Saleem Watson
Publisher:
Cengage Learning
Algebra and Trigonometry (MindTap Course List)
Algebra
ISBN:
9781305071742
Author:
James Stewart, Lothar Redlin, Saleem Watson
Publisher:
Cengage Learning

Algebra & Trigonometry with Analytic Geometry
Algebra
ISBN:
9781133382119
Author:
Swokowski
Publisher:
Cengage