A sample of birth weights of 13 girls was taken. Below are the results (in g): 2961.8 3509.5 2808.6 1212.4 2037.3 4224.7 3083.2 3423.6 3967.3 3252.4 2945.8 2494.6 4165.6 3083.6 g s = 848.12 g Use a 10% significance level to test the claim that the standard deviation of birth weights of girls is greater than the standard deviation of birth weights of boys, which is 520 g. Round all answers to 3 decimal places if possible. Procedure: Select an answer Step 1. Hypotheses Set-Up: Ho: Select an answer O Ha: Select an answer ? O The test is a Select an answer test. Step 2. The significance level is a = Step 3. Compute the value of the test statistic: II
A sample of birth weights of 13 girls was taken. Below are the results (in g): 2961.8 3509.5 2808.6 1212.4 2037.3 4224.7 3083.2 3423.6 3967.3 3252.4 2945.8 2494.6 4165.6 3083.6 g s = 848.12 g Use a 10% significance level to test the claim that the standard deviation of birth weights of girls is greater than the standard deviation of birth weights of boys, which is 520 g. Round all answers to 3 decimal places if possible. Procedure: Select an answer Step 1. Hypotheses Set-Up: Ho: Select an answer O Ha: Select an answer ? O The test is a Select an answer test. Step 2. The significance level is a = Step 3. Compute the value of the test statistic: II

MATLAB: An Introduction with Applications
6th Edition
ISBN:9781119256830
Author:Amos Gilat
Publisher:Amos Gilat
Chapter1: Starting With Matlab
Section: Chapter Questions
Problem 1P

Related questions
Question
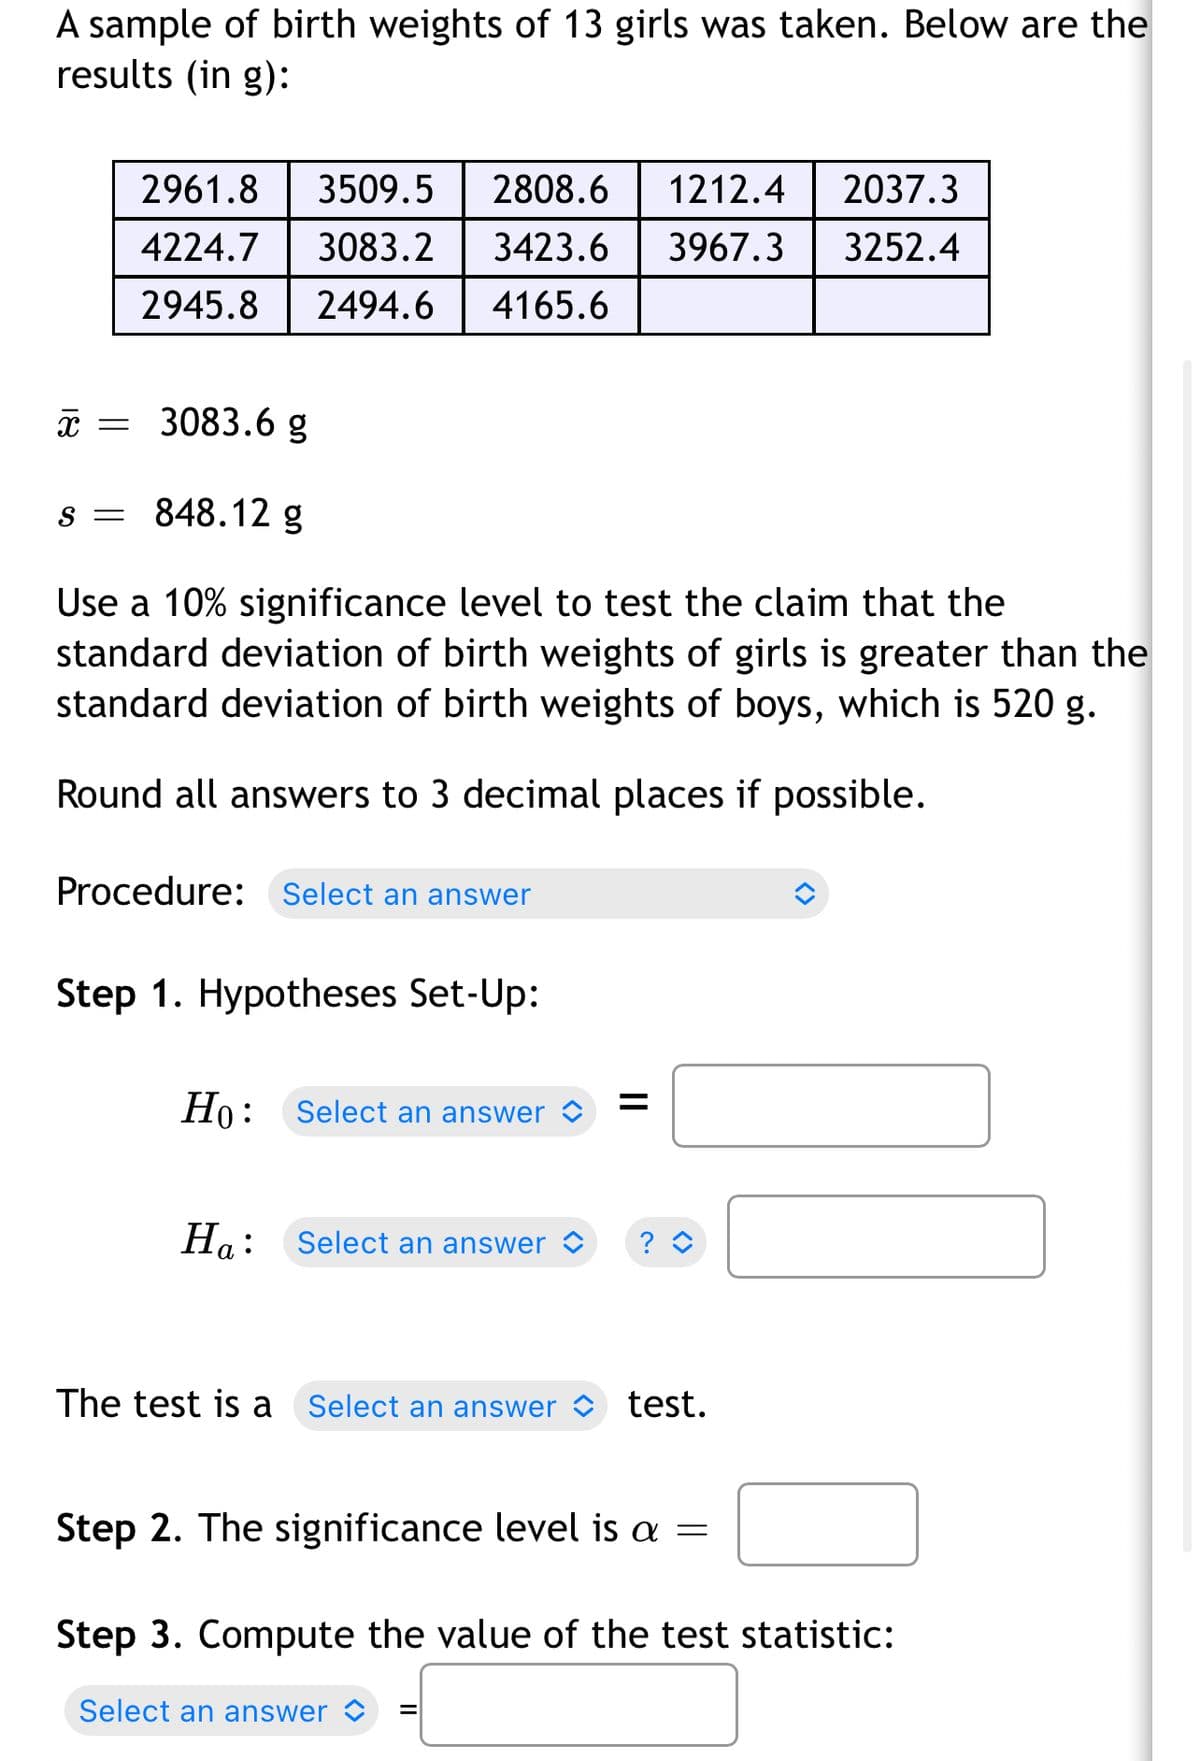
Transcribed Image Text:A sample of birth weights of 13 girls was taken. Below are the
results (in g):
2961.8
3509.5
2808.6
1212.4
2037.3
4224.7
3083.2
3423.6
3967.3
3252.4
2945.8
2494.6
4165.6
3083.6 g
s = 848.12 g
Use a 10% significance level to test the claim that the
standard deviation of birth weights of girls is greater than the
standard deviation of birth weights of boys, which is 520 g.
Round all answers to 3 decimal places if possible.
Procedure: Select an answer
Step 1. Hypotheses Set-Up:
Но:
Ho: Select an answer
На:
Select an answer
The test is a Select an answer test.
Step 2. The significance level is a =
Step 3. Compute the value of the test statistic:
Select an answer
Expert Solution
This question has been solved!
Explore an expertly crafted, step-by-step solution for a thorough understanding of key concepts.

This is a popular solution!

Trending now
This is a popular solution!

Step by step
Solved in 2 steps with 2 images

Recommended textbooks for you
MATLAB: An Introduction with Applications
Statistics
ISBN:
9781119256830
Author:
Amos Gilat
Publisher:
John Wiley & Sons Inc

Probability and Statistics for Engineering and th…
Statistics
ISBN:
9781305251809
Author:
Jay L. Devore
Publisher:
Cengage Learning

Statistics for The Behavioral Sciences (MindTap C…
Statistics
ISBN:
9781305504912
Author:
Frederick J Gravetter, Larry B. Wallnau
Publisher:
Cengage Learning
MATLAB: An Introduction with Applications
Statistics
ISBN:
9781119256830
Author:
Amos Gilat
Publisher:
John Wiley & Sons Inc
Probability and Statistics for Engineering and th…
Statistics
ISBN:
9781305251809
Author:
Jay L. Devore
Publisher:
Cengage Learning
Statistics for The Behavioral Sciences (MindTap C…
Statistics
ISBN:
9781305504912
Author:
Frederick J Gravetter, Larry B. Wallnau
Publisher:
Cengage Learning

Elementary Statistics: Picturing the World (7th E…
Statistics
ISBN:
9780134683416
Author:
Ron Larson, Betsy Farber
Publisher:
PEARSON

The Basic Practice of Statistics
Statistics
ISBN:
9781319042578
Author:
David S. Moore, William I. Notz, Michael A. Fligner
Publisher:
W. H. Freeman

Introduction to the Practice of Statistics
Statistics
ISBN:
9781319013387
Author:
David S. Moore, George P. McCabe, Bruce A. Craig
Publisher:
W. H. Freeman