2. On a certain trajectory, a 100 cars were tested. The fuel consumption (litres per 100 km, rounded to 2 decimals) was measured. Summary statistics as provided by Excel are shown as well. 3,94 5,16 5,60 5,80 6,12 6,60 6,90 7,18 7,37 7,82 4,06 5,31 5,61 5,86 6,15 6,67 6,90 7,20 7,43 7,98 4,49 5,31 5,64 5,95 6,15 6,70 6,90 7,25 7,43 7,98 4,55 5,42 5,66 5,96 6,17 6,71 6,97 7,28 7,48 8,19 4,76 5,42 5,66 5,97 6,19 6,71 7,00 7,29 7,53 8,25 4,83 5,42 5,66 6,00 6,22 6,72 7,02 7,29 7,58 8,37 6,28 6,73 7,04 7,30 7,61 8,41 4,92 5,50 5,72 6,07 4,95 5,55 5,74 6,09 6,38 6,73 7,10 7,35 7,63 8,72 5,06 5,59 5,77 6,10 6,41 6,77 7,16 7,36 7,70 8,83 5,07 5,60 5,78 6,11 6,45 6,80 7,16 7,37 7,79 9,61 Mean Standard Error Median Mode Standard Deviation. Sample Variance Kurtosis Skewness Range Minimum Maximum Sum Count fuel consumption a. Determine appropriate binning as the starting point for a histogram. b. Determine the quartiles. c. Set up a boxplot. 6,5005 0,1087 6,5250 6,9000 1,0869 1,1813 -0,1098 0,1150 5,67 3,94 9,61 650,05 100
2. On a certain trajectory, a 100 cars were tested. The fuel consumption (litres per 100 km, rounded to 2 decimals) was measured. Summary statistics as provided by Excel are shown as well. 3,94 5,16 5,60 5,80 6,12 6,60 6,90 7,18 7,37 7,82 4,06 5,31 5,61 5,86 6,15 6,67 6,90 7,20 7,43 7,98 4,49 5,31 5,64 5,95 6,15 6,70 6,90 7,25 7,43 7,98 4,55 5,42 5,66 5,96 6,17 6,71 6,97 7,28 7,48 8,19 4,76 5,42 5,66 5,97 6,19 6,71 7,00 7,29 7,53 8,25 4,83 5,42 5,66 6,00 6,22 6,72 7,02 7,29 7,58 8,37 6,28 6,73 7,04 7,30 7,61 8,41 4,92 5,50 5,72 6,07 4,95 5,55 5,74 6,09 6,38 6,73 7,10 7,35 7,63 8,72 5,06 5,59 5,77 6,10 6,41 6,77 7,16 7,36 7,70 8,83 5,07 5,60 5,78 6,11 6,45 6,80 7,16 7,37 7,79 9,61 Mean Standard Error Median Mode Standard Deviation. Sample Variance Kurtosis Skewness Range Minimum Maximum Sum Count fuel consumption a. Determine appropriate binning as the starting point for a histogram. b. Determine the quartiles. c. Set up a boxplot. 6,5005 0,1087 6,5250 6,9000 1,0869 1,1813 -0,1098 0,1150 5,67 3,94 9,61 650,05 100

Glencoe Algebra 1, Student Edition, 9780079039897, 0079039898, 2018
18th Edition
ISBN:9780079039897
Author:Carter
Publisher:Carter
Chapter10: Statistics
Section10.6: Summarizing Categorical Data
Problem 23PPS

Related questions
Question
could you please answer with paper and pen?
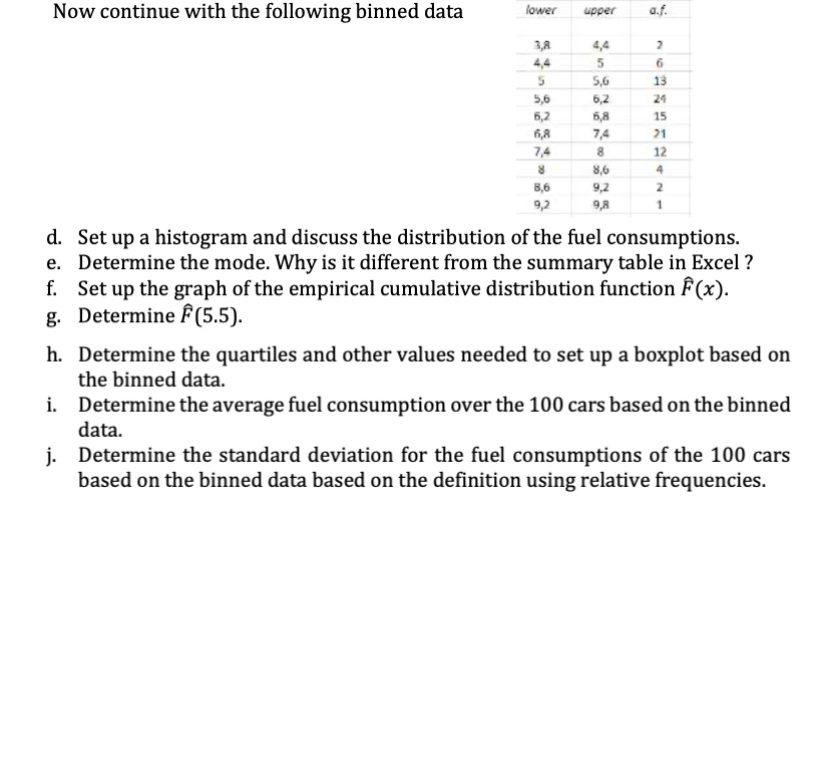
Transcribed Image Text:Now continue with the following binned data
lower
3,8
5
5,6
6,2
6,8
7,4
8
8,6
9,2
upper a.f.
5
5,6
6,2
6,8
7,4
8
8,6
9,2
9,8
76325
13
24
15
21
12
4
2
1
d. Set up a histogram and discuss the distribution of the fuel consumptions.
e. Determine the mode. Why is it different from the summary table in Excel ?
f. Set up the graph of the empirical cumulative distribution function F(x).
Determine (5.5).
g.
h. Determine the quartiles and other values needed to set up a boxplot based on
the binned data.
i. Determine the average fuel consumption over the 100 cars based on the binned
data.
j.
Determine the standard deviation for the fuel consumptions of the 100 cars
based on the binned data based on the definition using relative frequencies.
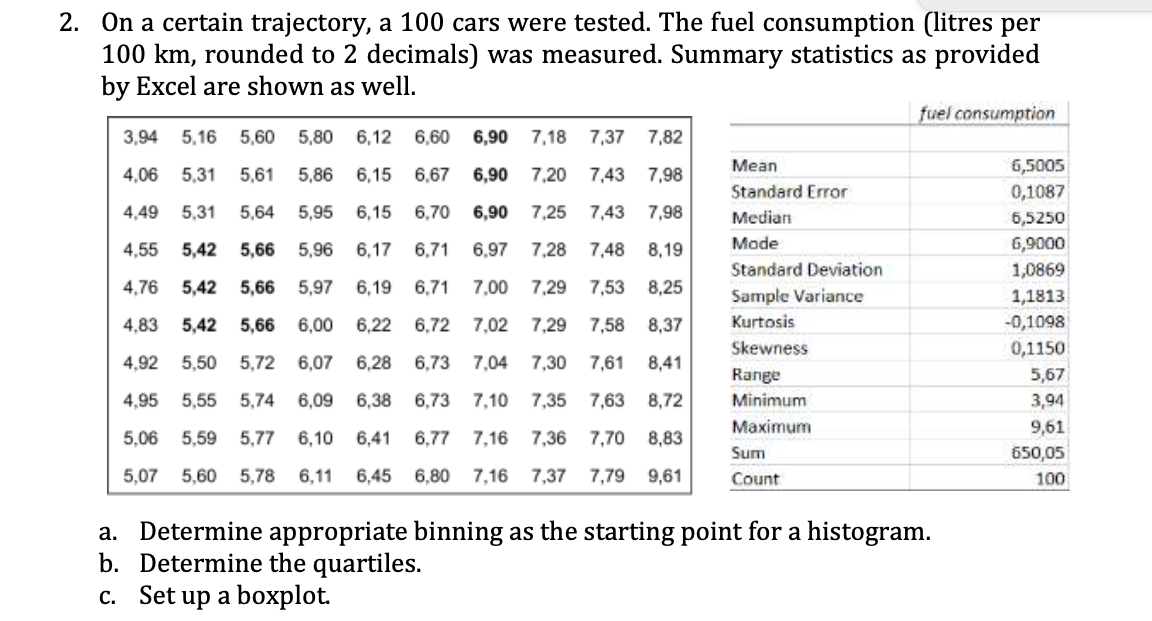
Transcribed Image Text:2. On a certain trajectory, a 100 cars were tested. The fuel consumption (litres per
100 km, rounded to 2 decimals) was measured. Summary statistics as provided
by Excel are shown as well.
3,94 5,16 5,60 5,80 6,12 6,60 6,90 7,18 7,37 7,82
4,06 5,31 5,61 5,86 6,15 6,67 6,90 7,20 7,43 7,98
4,49 5,31 5,64 5,95 6,15 6,70 6,90 7,25 7,43 7,98
4,55 5,42 5,66 5,96 6,17 6,71 6,97 7,28 7,48 8,19
4,76 5,42 5,66 5,97
6,19
6,71 7,00 7,29 7,53 8,25
4,83 5,42 5,66 6,00 6,22 6,72 7,02 7,29 7,58 8,37
4,92 5,50 5,72 6,07
4,95 5,55
5,74 6,09 6,38 6,73 7,10
5,06 5,59 5,77 6,10 6,41 6,77 7,16 7,36 7,70 8,83
5,07 5,60 5,78 6,11 6,45 6,80 7,16 7,37 7,79
6,28 6,73 7,04 7,30 7,61 8,41
7,35 7,63 8,72
9,61
Mean
Standard Error
Median
Mode
Standard Deviation.
Sample Variance
Kurtosis
Skewness
Range
Minimum
Maximum
Sum
Count
fuel consumption
a. Determine appropriate binning as the starting point for a histogram.
b. Determine the quartiles.
c. Set up a boxplot.
6,5005
0,1087
6,5250
6,9000
1,0869
1,1813
-0,1098
0,1150
5,67
3,94
9,61
650,05
100
Expert Solution
This question has been solved!
Explore an expertly crafted, step-by-step solution for a thorough understanding of key concepts.

Step by step
Solved in 4 steps with 3 images

Recommended textbooks for you
Glencoe Algebra 1, Student Edition, 9780079039897…
Algebra
ISBN:
9780079039897
Author:
Carter
Publisher:
McGraw Hill

Elementary Geometry For College Students, 7e
Geometry
ISBN:
9781337614085
Author:
Alexander, Daniel C.; Koeberlein, Geralyn M.
Publisher:
Cengage,

Holt Mcdougal Larson Pre-algebra: Student Edition…
Algebra
ISBN:
9780547587776
Author:
HOLT MCDOUGAL
Publisher:
HOLT MCDOUGAL
Glencoe Algebra 1, Student Edition, 9780079039897…
Algebra
ISBN:
9780079039897
Author:
Carter
Publisher:
McGraw Hill
Elementary Geometry For College Students, 7e
Geometry
ISBN:
9781337614085
Author:
Alexander, Daniel C.; Koeberlein, Geralyn M.
Publisher:
Cengage,
Holt Mcdougal Larson Pre-algebra: Student Edition…
Algebra
ISBN:
9780547587776
Author:
HOLT MCDOUGAL
Publisher:
HOLT MCDOUGAL