2. Real versus nominal GDP Consider a simple economy that produces two goods: pencils and envelopes. The following table shows the prices and quantities of the goods over a three-year period. Pencils Envelopes Price Quantity Price Quantity Year (Dollars per pencil) (Number of pencils) (Dollars per envelope) (Number of envelopes) 2016 1 125 200 2017 170 4 230 2018 150 4 170
2. Real versus nominal GDP Consider a simple economy that produces two goods: pencils and envelopes. The following table shows the prices and quantities of the goods over a three-year period. Pencils Envelopes Price Quantity Price Quantity Year (Dollars per pencil) (Number of pencils) (Dollars per envelope) (Number of envelopes) 2016 1 125 200 2017 170 4 230 2018 150 4 170

Brief Principles of Macroeconomics (MindTap Course List)
8th Edition
ISBN:9781337091985
Author:N. Gregory Mankiw
Publisher:N. Gregory Mankiw
Chapter5: Measuring A Nation's Income
Section: Chapter Questions
Problem 7QR

Related questions
Question
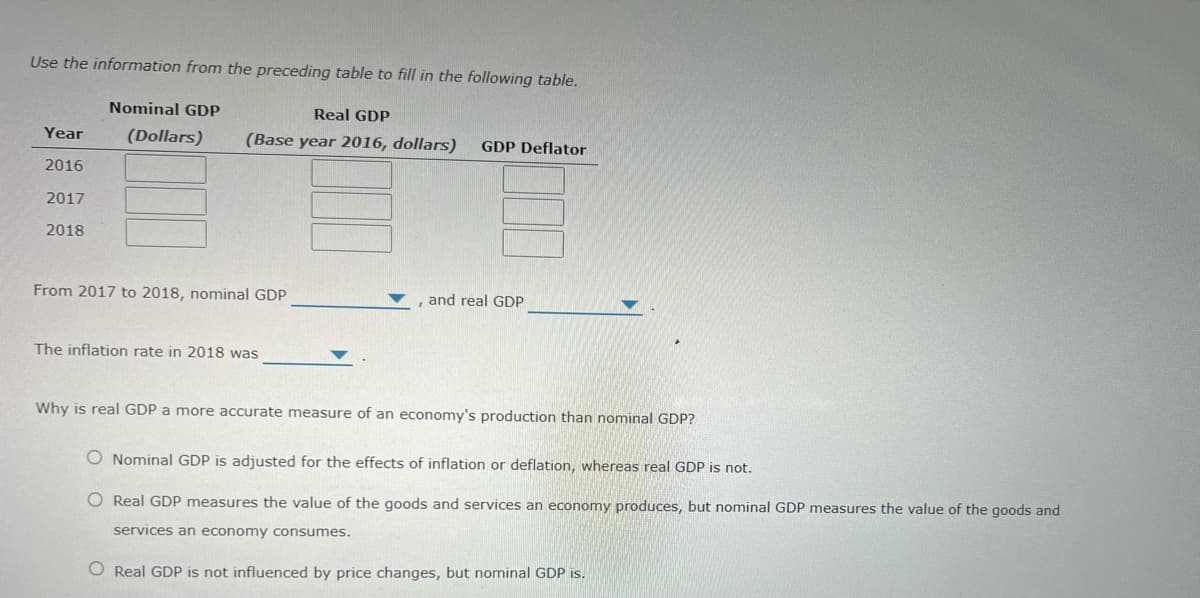
Transcribed Image Text:Use the information from the preceding table to fill in the following table.
Nominal GDP
Real GDP
Year
(Dollars)
(Base year 2016, dollars)
GDP Deflator
2016
2017
2018
From 2017 to 2018, nominal GDP
and real GDP
The inflation rate in 2018 was
Why is real GDP a more accurate measure of an economy's production than nominal GDP?
O Nominal GDP is adjusted for the effects of inflation or deflation, whereas real GDP is not.
O Real GDP measures the value of the goods and services an economy produces, but nominal GDP measures the value of the goods and
services an economy consumes.
O Real GDP is not influenced by price changes, but nominal GDP is.
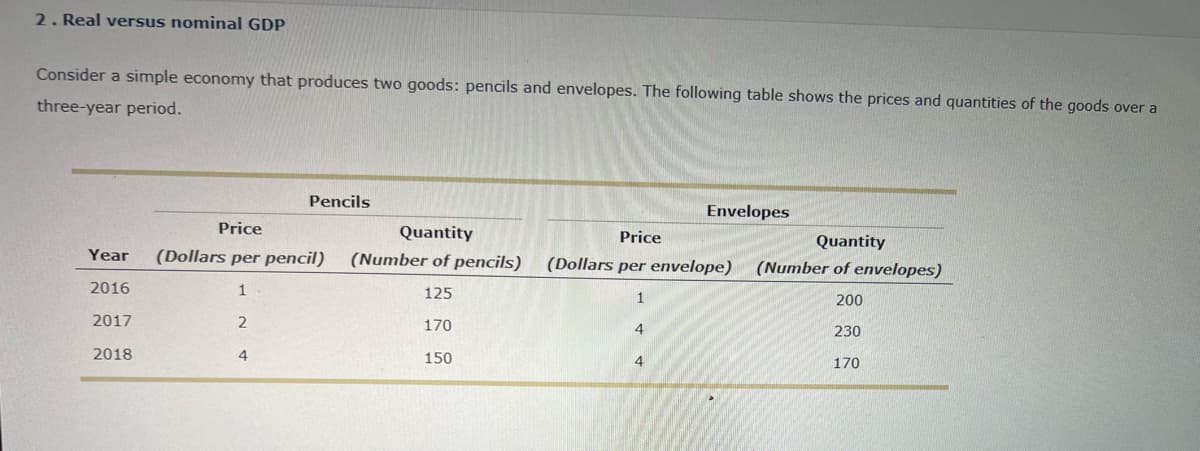
Transcribed Image Text:2. Real versus nominal GDP
Consider a simple economy that produces two goods: pencils and envelopes. The following table shows the prices and quantities of the goods over a
three-year period.
Pencils
Envelopes
Price
Quantity
Price
Quantity
Year
(Dollars per pencil)
(Number of pencils)
(Dollars per envelope)
(Number of envelopes)
2016
1
125
200
2017
170
4
230
2018
150
4
170
Expert Solution
This question has been solved!
Explore an expertly crafted, step-by-step solution for a thorough understanding of key concepts.

This is a popular solution!

Trending now
This is a popular solution!

Step by step
Solved in 2 steps with 1 images

Knowledge Booster


Learn more about
Need a deep-dive on the concept behind this application? Look no further. Learn more about this topic, economics and related others by exploring similar questions and additional content below.Recommended textbooks for you
Brief Principles of Macroeconomics (MindTap Cours…
Economics
ISBN:
9781337091985
Author:
N. Gregory Mankiw
Publisher:
Cengage Learning

Essentials of Economics (MindTap Course List)
Economics
ISBN:
9781337091992
Author:
N. Gregory Mankiw
Publisher:
Cengage Learning

Brief Principles of Macroeconomics (MindTap Cours…
Economics
ISBN:
9781337091985
Author:
N. Gregory Mankiw
Publisher:
Cengage Learning
Essentials of Economics (MindTap Course List)
Economics
ISBN:
9781337091992
Author:
N. Gregory Mankiw
Publisher:
Cengage Learning

Principles of Economics 2e
Economics
ISBN:
9781947172364
Author:
Steven A. Greenlaw; David Shapiro
Publisher:
OpenStax