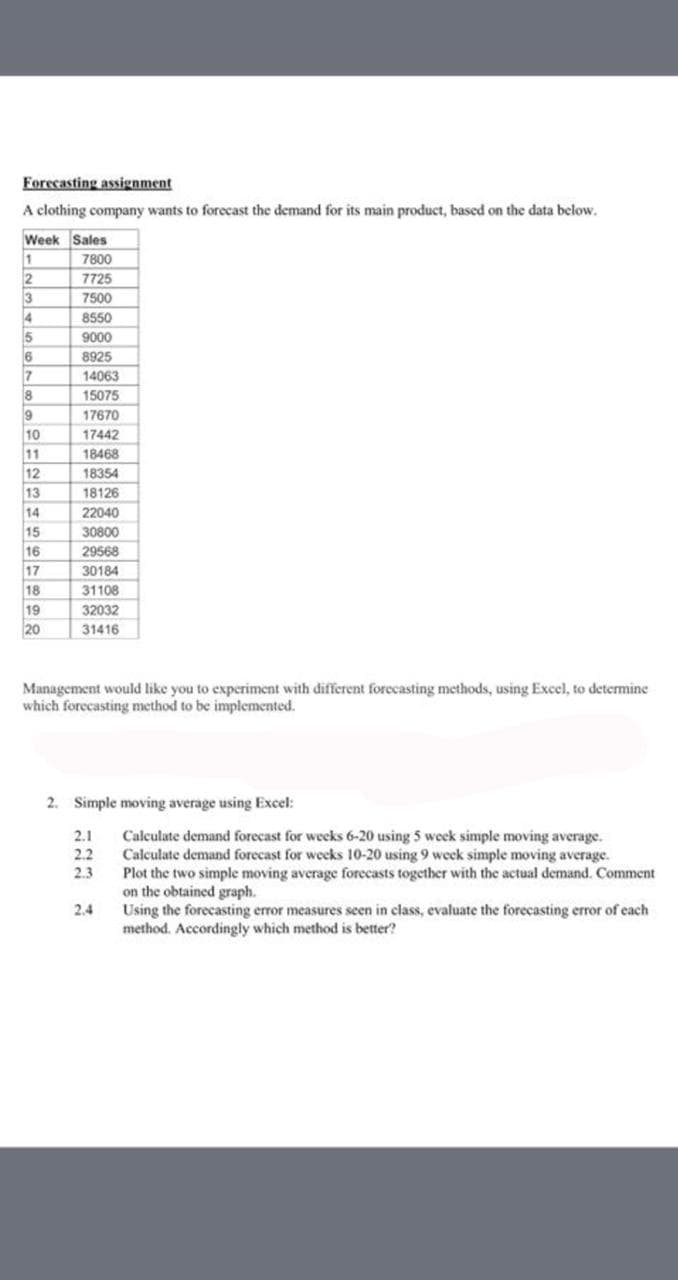
2. Simple moving average using Excel: Calculate demand forecast for weeks 6-20 using 5 week simple moving average. Calculate demand forecast for weeks 10-20 using 9 week simple moving average. Plot the two simple moving average forecasts together with the actual demand. Comment on the obtained graph. Using the forecasting error measures seen in class, evaluate the forecasting error of each method. Accordingly which method is better? 2.1 2.2 2.3 2.4


Q: Answer the following: Consider the impact and contribution of outsourcing on the global business env...
A: When a company hires or contracts with another external company to perform their tasks for a specifi...
Q: Freeze Inc.’s CEO established as a goal for top management to complete the project on or before 22 w...
A: Activity-on-node is a project management term that leads to a precedence diagramming method that use...
Q: Describe the four categories of quality costs and provide examples of each form of quality cost that...
A: Every product needs to achieve certain performance requirements, here, here, the firm needs to plan ...
Q: Explain the difference between Prototype and Minimal Viable Product.
A: Digital product development can be stated as the approach of bringing an electronic concept to life ...
Q: PT Cahaya Pintar Utama (PT. CPU) makes special lights that are popular in new homes. PT. CPU demand ...
A: given,
Q: If Tom decides to order at the economic order quantity, what is the TBO?
A: EOQ stands for economic order quantity. It is a firm's optimal order quantity that undervalues its t...
Q: The unit of measure that is chosen for tracking schedule progress can affect the quality of the work...
A: Schedule progress means when a work is planned and is running according to its planned schedule and ...
Q: ElectroExpert makes three models of slip rings. The current order amount for each model is given in ...
A: Objective Functions and Constraints: Based on the given details, the objective funct...
Q: Peach Company uses 800 units of a product per year on a continuous basis. The product has a Fixed Co...
A: Given data Annual demand = 800 units Fixed cost (S) = $50 Carrying or holding cost (H) = $2 Lead ...
Q: Big Rock Paper Scissors, Inc. operates paper plants in Chicago, Illinois, and The Bronx, New York. W...
A: a)
Q: True or False Cost driver analysis is a comprehensive understanding of how an organization generate...
A: The Cost driver analysis may be defined as the analysis of various cost drivers for a particular typ...
Q: The output of a plant is 4335 pounds of ball bearings per week (five days). If each ball bearing wei...
A: Given data is Output = 4335 pounds Number of days = 5 Weight of ball bearing = 0.0113 gram
Q: True or False: An inventory management system that relies primarily on the physical counts of invent...
A: The current answer is True.
Q: A paper published in the Harvard Business Review points out a new way to calculate economic profit t...
A: An individual's productivity is how much work they can do in a given measure of time. It's a straigh...
Q: Critically analyze whether companies, will need to revisit aspects of their employee pay structures ...
A: In the aftermath of the coronavirus shutdown, firms have a major issue in making judgments regarding...
Q: If the annual demand of gear is 24000 units, replenishment cost is Rs 20 and the cost of holding a u...
A:
Q: Checkout time at a supermarket is monitored using a mean and a range chart. Six samples of n = 20 ob...
A: Here, as per the request, I'm supposed to answer question 2. for each sample, I have the mean value ...
Q: Under ideal conditions, a service bay at a Fast Lube can serve 7 cars per hour The effective capacit...
A: Production is the process of developing finished products using the raw resources and materials for ...
Q: Mary Beth Marrs, the manager of an apartment complex, feels overwhelmed by the number of complaints ...
A: Pareto Charts is a graph that shows the frequency of defects, with their cumulative result. Pareto C...
Q: Part B:Please solve the problem using the graphical method
A: Linear programming is a process to reach the best result such as maximum profit or lowest cost in a ...
Q: Which of the following is NOT an assumption of the BOQ model? 1) inventory is replenished instantan...
A: BOQ(Best order quantity) means finding out the best number of units needed to be ordered to lower d...
Q: employees are paid based on the number of items that are produced
A: work measurement and payment selection model helps to identify the employee payment method based on ...
Q: Would you say that system with higher efficiency ratios rather than other systems will have higher u...
A: There is often confusion between efficiency and utilization and sometimes both these terms are consi...
Q: ch, 1. Prepare a flowchart on preparing You need to follow the correct flow chart symbol. meal, you ...
A: COOKING AN EGG: 1. If Scrambled, then egg is cracked egg is broken with mike and butter ...
Q: we worked on a problem for Flor’s Flours, a small business that produces two types of ready-to-use m...
A:
Q: Discuss whether any duty drawback is admissible under section 75 of Customs Act in the following cas...
A: Section 75 of Customs Act: Admissibility of Drawback The drawback under section 75 is on a whole ot...
Q: 1. Why is project cost control important?
A: Since you have asked multiple questions, we will solve the first question for you. If you want any s...
Q: Using the cut-and-try method for aggregate operations planning, as described in the textbook, we can...
A: Safety stock is the stock that any business maintain so that the shortage issue can be eliminated in...
Q: 2. A company has three branches: Manila Branch, Davao Branch, and Tacloban Branch. These branches...
A: Given data is
Q: Davison Construction Company is building a luxury lakefront home in the Finger Lakes region of New Y...
A: Given-
Q: Covey believes effective people continuously sharpen their saws. What are the consequences of not sh...
A: Improving and upgrading yourself with the time is sharping your saws. It is enhancing yourself with ...
Q: What is alternative optima in linear programming is about?
A: Linear method is described as the mathematical approach of determining the best possible solutions o...
Q: Using the Solver, find the solution and answer the questions given below the LP
A: The optimal solution can be developed as follows:
Q: What is the reorder point
A: Reorder point is the stock level that initiate new order for fill the stock level. Its about the sum...
Q: Solve the problem about linear programming subparts A,B,C with the step and no reject. Im needed in ...
A:
Q: An example can be seen in the operation of a security-conscious jewelry shop. Customers are allowed ...
A: Operations management is described as a process through which business practices are put up to the h...
Q: In terms of the optimality principle, define dynamic programming.
A: Dynamic Programming refers to a approach of optimization where a complex problem is transformed into...
Q: Case Narrative: As a young investor with a moderate risk attitude, you consulted a financial adviser...
A: GIVEN,
Q: . What is a schedule and why is it important in project planning? Explain your answer in detail.
A: A far-reaching process of designing a project schedule that outlines the project phases, tasks under...
Q: John Doe, a fraud examiner, has been hired by ABC Corporation to investigate a shortage of cash, whi...
A: Business frauds are often called illegal activities or operations. Business fraud can be stated as a...
Q: Tastie Food Company has decided to come up with two variety of tomato sauce – one that is spicy and ...
A: Decision variable: Suppose-X = No. of bottles of spicy tomato sauceY = No. of bottles of non-spicy...
Q: operational decisions related to capacity and process technology
A: flexibility as key performance objective indicating the requirement of processing multiple products ...
Q: At sejahtera.com, a large retailer of popular books, demand is constant at 32,000 books per year. Th...
A: Here, given data annual demand=32000 The cost of placing the order=10 The annual cost of holding =4 ...
Q: 1. A bakeshop has recorded sales (in dozens) for three products, as shown belowboar en a. Predict or...
A: Given-
Q: Name the part of brand which can't be spoken but can be recognized. Question 17 options: Bra...
A: A branding is done to a product to make it unique in the market and helps to differentiate a product...
Q: Decision Making and Involvement - Perception - Attitudes
A: Decision Making and Involvement-Consumer decision making refers to the process in which the consumer...
Q: A massive network of seawalls is possibly going to be constructed right in the middle of Miami Beach...
A: The correct answer is A.
Q: .•• 2.11 hired by a local restaurant to perform a factor-rating analysis to help the restaurant choo...
A: Outsourcing is the business practice of recruiting a party outside an organization to perform benefi...
Q: Assume that Triksi Co. makes footballs and is trying to determine the quantity of leather it should ...
A: The detailed solution is given in Step 2.
Q: What is the role of a project manager throughout the project life cycle
A: Project management is the management in which different kinds of skills and knowledge are used to pr...


Trending now
This is a popular solution!

Step by step
Solved in 5 steps with 7 images

- Under what conditions might a firm use multiple forecasting methods?Scenario 4 Sharon Gillespie, a new buyer at Visionex, Inc., was reviewing quotations for a tooling contract submitted by four suppliers. She was evaluating the quotes based on price, target quality levels, and delivery lead time promises. As she was working, her manager, Dave Cox, entered her office. He asked how everything was progressing and if she needed any help. She mentioned she was reviewing quotations from suppliers for a tooling contract. Dave asked who the interested suppliers were and if she had made a decision. Sharon indicated that one supplier, Apex, appeared to fit exactly the requirements Visionex had specified in the proposal. Dave told her to keep up the good work. Later that day Dave again visited Sharons office. He stated that he had done some research on the suppliers and felt that another supplier, Micron, appeared to have the best track record with Visionex. He pointed out that Sharons first choice was a new supplier to Visionex and there was some risk involved with that choice. Dave indicated that it would please him greatly if she selected Micron for the contract. The next day Sharon was having lunch with another buyer, Mark Smith. She mentioned the conversation with Dave and said she honestly felt that Apex was the best choice. When Mark asked Sharon who Dave preferred, she answered, Micron. At that point Mark rolled his eyes and shook his head. Sharon asked what the body language was all about. Mark replied, Look, I know youre new but you should know this. I heard last week that Daves brother-in-law is a new part owner of Micron. I was wondering how soon it would be before he started steering business to that company. He is not the straightest character. Sharon was shocked. After a few moments, she announced that her original choice was still the best selection. At that point Mark reminded Sharon that she was replacing a terminated buyer who did not go along with one of Daves previous preferred suppliers. Ethical decisions that affect a buyers ethical perspective usually involve the organizational environment, cultural environment, personal environment, and industry environment. Analyze this scenario using these four variables.Scenario 4 Sharon Gillespie, a new buyer at Visionex, Inc., was reviewing quotations for a tooling contract submitted by four suppliers. She was evaluating the quotes based on price, target quality levels, and delivery lead time promises. As she was working, her manager, Dave Cox, entered her office. He asked how everything was progressing and if she needed any help. She mentioned she was reviewing quotations from suppliers for a tooling contract. Dave asked who the interested suppliers were and if she had made a decision. Sharon indicated that one supplier, Apex, appeared to fit exactly the requirements Visionex had specified in the proposal. Dave told her to keep up the good work. Later that day Dave again visited Sharons office. He stated that he had done some research on the suppliers and felt that another supplier, Micron, appeared to have the best track record with Visionex. He pointed out that Sharons first choice was a new supplier to Visionex and there was some risk involved with that choice. Dave indicated that it would please him greatly if she selected Micron for the contract. The next day Sharon was having lunch with another buyer, Mark Smith. She mentioned the conversation with Dave and said she honestly felt that Apex was the best choice. When Mark asked Sharon who Dave preferred, she answered, Micron. At that point Mark rolled his eyes and shook his head. Sharon asked what the body language was all about. Mark replied, Look, I know youre new but you should know this. I heard last week that Daves brother-in-law is a new part owner of Micron. I was wondering how soon it would be before he started steering business to that company. He is not the straightest character. Sharon was shocked. After a few moments, she announced that her original choice was still the best selection. At that point Mark reminded Sharon that she was replacing a terminated buyer who did not go along with one of Daves previous preferred suppliers. What should Sharon do in this situation?
- Scenario 4 Sharon Gillespie, a new buyer at Visionex, Inc., was reviewing quotations for a tooling contract submitted by four suppliers. She was evaluating the quotes based on price, target quality levels, and delivery lead time promises. As she was working, her manager, Dave Cox, entered her office. He asked how everything was progressing and if she needed any help. She mentioned she was reviewing quotations from suppliers for a tooling contract. Dave asked who the interested suppliers were and if she had made a decision. Sharon indicated that one supplier, Apex, appeared to fit exactly the requirements Visionex had specified in the proposal. Dave told her to keep up the good work. Later that day Dave again visited Sharons office. He stated that he had done some research on the suppliers and felt that another supplier, Micron, appeared to have the best track record with Visionex. He pointed out that Sharons first choice was a new supplier to Visionex and there was some risk involved with that choice. Dave indicated that it would please him greatly if she selected Micron for the contract. The next day Sharon was having lunch with another buyer, Mark Smith. She mentioned the conversation with Dave and said she honestly felt that Apex was the best choice. When Mark asked Sharon who Dave preferred, she answered, Micron. At that point Mark rolled his eyes and shook his head. Sharon asked what the body language was all about. Mark replied, Look, I know youre new but you should know this. I heard last week that Daves brother-in-law is a new part owner of Micron. I was wondering how soon it would be before he started steering business to that company. He is not the straightest character. Sharon was shocked. After a few moments, she announced that her original choice was still the best selection. At that point Mark reminded Sharon that she was replacing a terminated buyer who did not go along with one of Daves previous preferred suppliers. What does the Institute of Supply Management code of ethics say about financial conflicts of interest?Scenario 3 Ben Gibson, the purchasing manager at Coastal Products, was reviewing purchasing expenditures for packaging materials with Jeff Joyner. Ben was particularly disturbed about the amount spent on corrugated boxes purchased from Southeastern Corrugated. Ben said, I dont like the salesman from that company. He comes around here acting like he owns the place. He loves to tell us about his fancy car, house, and vacations. It seems to me he must be making too much money off of us! Jeff responded that he heard Southeastern Corrugated was going to ask for a price increase to cover the rising costs of raw material paper stock. Jeff further stated that Southeastern would probably ask for more than what was justified simply from rising paper stock costs. After the meeting, Ben decided he had heard enough. After all, he prided himself on being a results-oriented manager. There was no way he was going to allow that salesman to keep taking advantage of Coastal Products. Ben called Jeff and told him it was time to rebid the corrugated contract before Southeastern came in with a price increase request. Who did Jeff know that might be interested in the business? Jeff replied he had several companies in mind to include in the bidding process. These companies would surely come in at a lower price, partly because they used lower-grade boxes that would probably work well enough in Coastal Products process. Jeff also explained that these suppliers were not serious contenders for the business. Their purpose was to create competition with the bids. Ben told Jeff to make sure that Southeastern was well aware that these new suppliers were bidding on the contract. He also said to make sure the suppliers knew that price was going to be the determining factor in this quote, because he considered corrugated boxes to be a standard industry item. Is Ben Gibson acting legally? Is he acting ethically? Why or why not?Scenario 3 Ben Gibson, the purchasing manager at Coastal Products, was reviewing purchasing expenditures for packaging materials with Jeff Joyner. Ben was particularly disturbed about the amount spent on corrugated boxes purchased from Southeastern Corrugated. Ben said, I dont like the salesman from that company. He comes around here acting like he owns the place. He loves to tell us about his fancy car, house, and vacations. It seems to me he must be making too much money off of us! Jeff responded that he heard Southeastern Corrugated was going to ask for a price increase to cover the rising costs of raw material paper stock. Jeff further stated that Southeastern would probably ask for more than what was justified simply from rising paper stock costs. After the meeting, Ben decided he had heard enough. After all, he prided himself on being a results-oriented manager. There was no way he was going to allow that salesman to keep taking advantage of Coastal Products. Ben called Jeff and told him it was time to rebid the corrugated contract before Southeastern came in with a price increase request. Who did Jeff know that might be interested in the business? Jeff replied he had several companies in mind to include in the bidding process. These companies would surely come in at a lower price, partly because they used lower-grade boxes that would probably work well enough in Coastal Products process. Jeff also explained that these suppliers were not serious contenders for the business. Their purpose was to create competition with the bids. Ben told Jeff to make sure that Southeastern was well aware that these new suppliers were bidding on the contract. He also said to make sure the suppliers knew that price was going to be the determining factor in this quote, because he considered corrugated boxes to be a standard industry item. As the Marketing Manager for Southeastern Corrugated, what would you do upon receiving the request for quotation from Coastal Products?
- Th e manager of a small health clinic would like to useexponential smoothing to forecast demand for laboratory servicesin the facility. However, she is not sure whether to use a high orlow value of α . To make her decision, she would like to comparethe forecast accuracy of a high and low α on historical data. Shehas decided to use an α = 0.7 for the high value and α = 0.1 forthe low value. Given the following historical data, which do youthink would be better to use? Week Demand (lab requirements)1 3302 3503 3204 3705 3686 343Daily high temperatures in St. Louis for the lastweek were as follows: 93, 94, 93, 95, 96, 88, 90 (yesterday).a) Forecast the high temperature today, using a 3-day movingaverage.b) Forecast the high temperature today, using a 2-day movingaverage.c) Calculate the mean absolute deviation based on a 2-daymoving average.d) Compute the mean squared error for the 2-day movingaverage.e) Calculate the mean absolute percent error for the 2-daymoving average.Week CheeseburgerSales 1 354 2 344 3 368 4 317 5 361 Based on historical observations over the past five weeks, make a forecast for the next period using the following methods: simple average, three-period moving average, and exponential smoothing with α = 0.4, given a forecast of 326 cheeseburgers for the first week. (Round your answers to 2 decimal places,e.g. 250.25) Simple average: F6 = enter forecast using a simple average 3-Period moving average: F6 = enter forecast using 3-Period moving average Exponential smoothing: F6 = enter forecast using exponential smoothing If actual sales for week 6 turn out to be 365, compare the three forecasts using MAD. Which method performed best?(Calculate your answers using the error only in period 6.) MAD (simple average) = enter forecast using a simple average of MAD MAD (3-period moving average) = enter forecast using 3-period moving average of MAD MAD (exponential smoothing) = enter forecast using exponential…
- Apply the moving average with base m=4 forecasting technique of the data to estimate the demand in week 13.Forecasting Forecasting is important relative to capacity requirements planning. What are some of the merits of using judgment methods (i.e., qualitative data) in contrast to quantitative forecasting methods. Which methods are considered to be superior or more accurate, and in what forecast situations would require judgment methods? In what situations would require a quantitative approach to forecasting?Explain what are the benefits of exponential smoothing over moving average forecasting ?

