ch, 1. Prepare a flowchart on preparing You need to follow the correct flow chart symbol. meal, you may choose either breakfast,
ch, 1. Prepare a flowchart on preparing You need to follow the correct flow chart symbol. meal, you may choose either breakfast,

Practical Management Science
6th Edition
ISBN:9781337406659
Author:WINSTON, Wayne L.
Publisher:WINSTON, Wayne L.
Chapter2: Introduction To Spreadsheet Modeling
Section: Chapter Questions
Problem 20P: Julie James is opening a lemonade stand. She believes the fixed cost per week of running the stand...

Related questions
Question
Answer number 1 only. Full solution. Unique answers only.
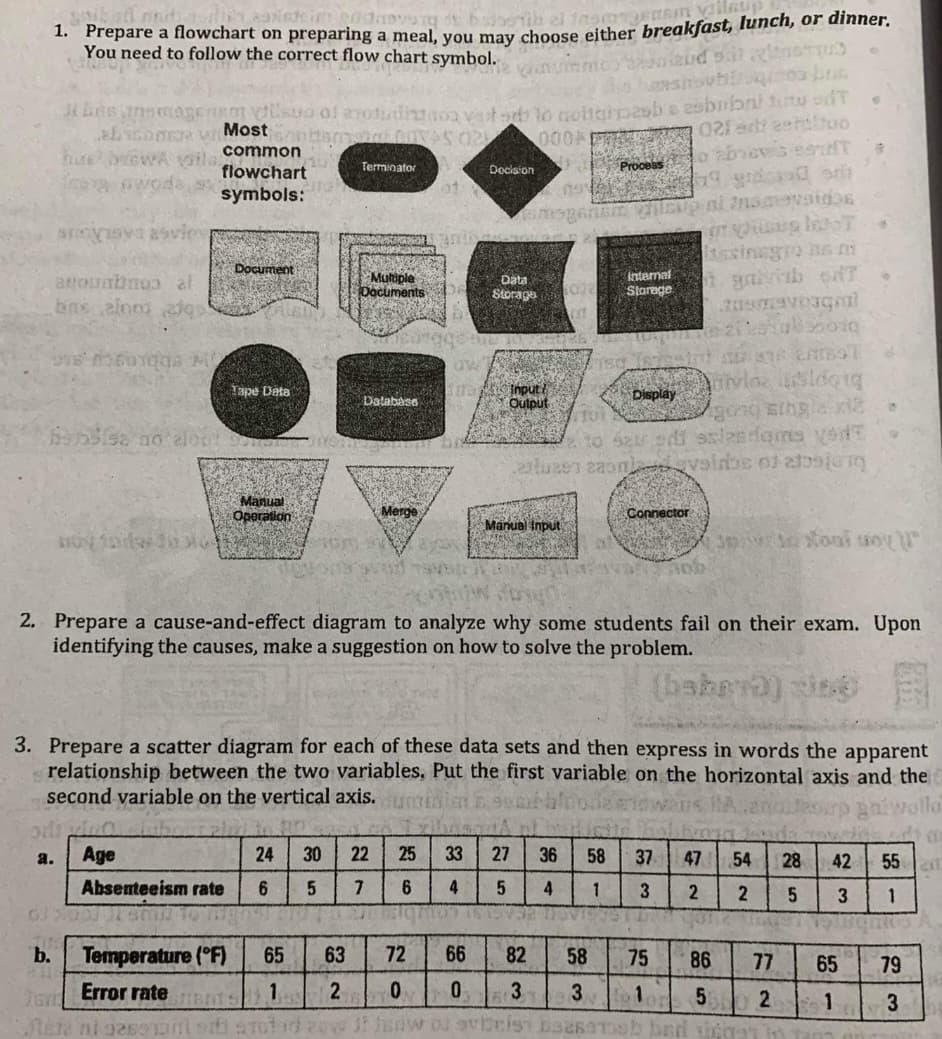
Transcribed Image Text:1. Prepare a flowchart on preparing a meal, you may choose either breakfast, lunch, or dinner.
You need to follow the correct flow chart symbol.
Most
hue bewA vtla
o abvevs esAT
common
Terminator
Proceas
flowchart
Docision
symbols:
tssinggso hs R
Document
arounbnos al
bas alnom ac
Multiple
Documents
Internal
Starage
Data
Storage
ivla sidotq
Input/
Output
Tape Data
Display
Database
aloot
to szu odi s/2sdams vodT
Manual
Operation
Merge
Connector
Manual Input
toni uoy
2. Prepare a cause-and-effect diagram to analyze why some students fail on their exam. Upon
identifying the causes, make a suggestion on how to solve the problem.
3. Prepare a scatter diagram for each of these data sets and then express in words the apparent
relationship between the two variables, Put the first variable on the horizontal axis and the
second variable on the vertical axis.
wolla
a.
Age
24
30
22
25
33
27
36
58
37
47
54
28
42
55
Absenteeism rate
6.
6.
4
4
3
b.
Temperature (°F)
65
63
72
66
82
58
75
86
77
65
79
Error rate Bnts
1.
2
3.
3.
fo1
2
1.
3
Expert Solution
This question has been solved!
Explore an expertly crafted, step-by-step solution for a thorough understanding of key concepts.

Step by step
Solved in 2 steps with 1 images

Recommended textbooks for you
Practical Management Science
Operations Management
ISBN:
9781337406659
Author:
WINSTON, Wayne L.
Publisher:
Cengage,

Operations Management
Operations Management
ISBN:
9781259667473
Author:
William J Stevenson
Publisher:
McGraw-Hill Education

Operations and Supply Chain Management (Mcgraw-hi…
Operations Management
ISBN:
9781259666100
Author:
F. Robert Jacobs, Richard B Chase
Publisher:
McGraw-Hill Education
Practical Management Science
Operations Management
ISBN:
9781337406659
Author:
WINSTON, Wayne L.
Publisher:
Cengage,
Operations Management
Operations Management
ISBN:
9781259667473
Author:
William J Stevenson
Publisher:
McGraw-Hill Education
Operations and Supply Chain Management (Mcgraw-hi…
Operations Management
ISBN:
9781259666100
Author:
F. Robert Jacobs, Richard B Chase
Publisher:
McGraw-Hill Education


Purchasing and Supply Chain Management
Operations Management
ISBN:
9781285869681
Author:
Robert M. Monczka, Robert B. Handfield, Larry C. Giunipero, James L. Patterson
Publisher:
Cengage Learning

Production and Operations Analysis, Seventh Editi…
Operations Management
ISBN:
9781478623069
Author:
Steven Nahmias, Tava Lennon Olsen
Publisher:
Waveland Press, Inc.