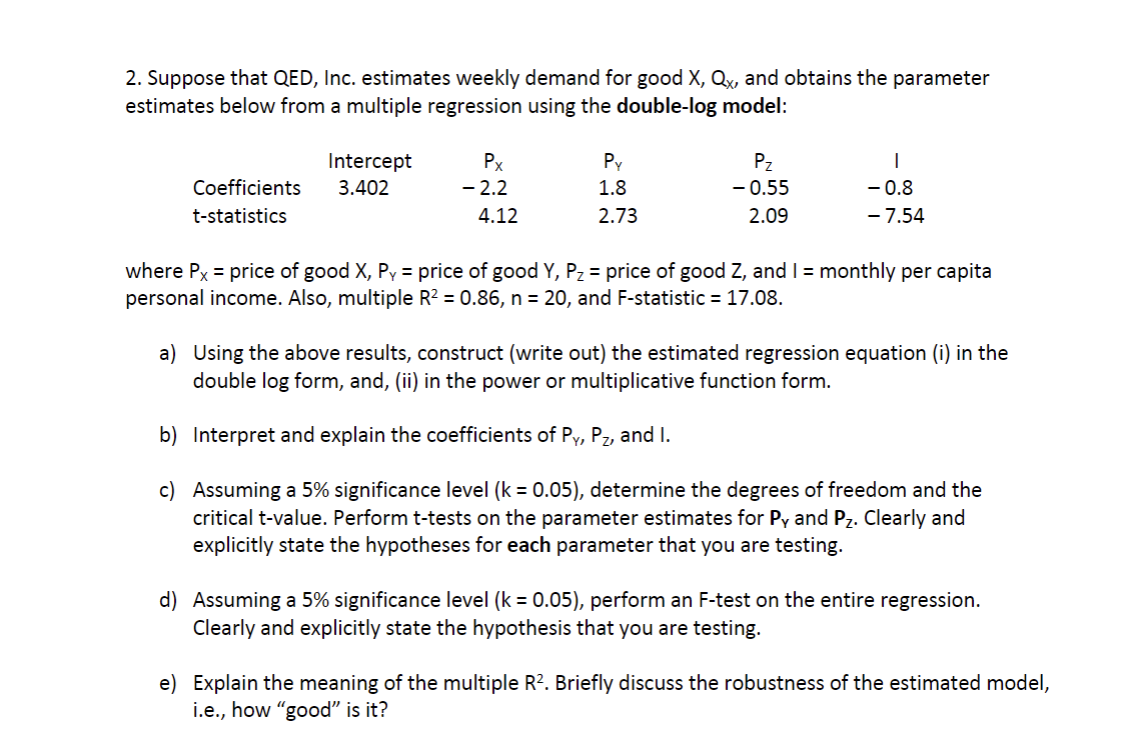
2. Suppose that QED, Inc. estimates weekly demand for good X, Qx, and obtains the parameter estimates below from a multiple regression using the double-log model: Px Py Pz I Intercept 3.402 Coefficients -2.2 1.8 -0.55 -0.8 t-statistics 4.12 2.73 2.09 -7.54 where Px = price of good X, Py = price of good Y, Pz = price of good Z, and I = monthly per capita personal income. Also, multiple R² = 0.86, n = 20, and F-statistic = 17.08. a) Using the above results, construct (write out) the estimated regression equation (i) in the double log form, and, (ii) in the power or multiplicative function form. b) Interpret and explain the coefficients of Py, P₂, and I. c) Assuming a 5% significance level (k = 0.05), determine the degrees of freedom and the critical t-value. Perform t-tests on the parameter estimates for Py and P₂. Clearly and explicitly state the hypotheses for each parameter that you are testing. d) Assuming a 5% significance level (k = 0.05), perform an F-test on the entire regression. Clearly and explicitly state the hypothesis that you are testing. e) Explain the meaning of the multiple R². Briefly discuss the robustness of the estimated model, i.e., how "good" is it?
2. Suppose that QED, Inc. estimates weekly demand for good X, Qx, and obtains the parameter estimates below from a multiple regression using the double-log model: Px Py Pz I Intercept 3.402 Coefficients -2.2 1.8 -0.55 -0.8 t-statistics 4.12 2.73 2.09 -7.54 where Px = price of good X, Py = price of good Y, Pz = price of good Z, and I = monthly per capita personal income. Also, multiple R² = 0.86, n = 20, and F-statistic = 17.08. a) Using the above results, construct (write out) the estimated regression equation (i) in the double log form, and, (ii) in the power or multiplicative function form. b) Interpret and explain the coefficients of Py, P₂, and I. c) Assuming a 5% significance level (k = 0.05), determine the degrees of freedom and the critical t-value. Perform t-tests on the parameter estimates for Py and P₂. Clearly and explicitly state the hypotheses for each parameter that you are testing. d) Assuming a 5% significance level (k = 0.05), perform an F-test on the entire regression. Clearly and explicitly state the hypothesis that you are testing. e) Explain the meaning of the multiple R². Briefly discuss the robustness of the estimated model, i.e., how "good" is it?

College Algebra
7th Edition
ISBN:9781305115545
Author:James Stewart, Lothar Redlin, Saleem Watson
Publisher:James Stewart, Lothar Redlin, Saleem Watson
Chapter1: Equations And Graphs
Section: Chapter Questions
Problem 10T: Olympic Pole Vault The graph in Figure 7 indicates that in recent years the winning Olympic men’s...

Related questions
Question
Need help with this question ASAP please
Transcribed Image Text:2. Suppose that QED, Inc. estimates weekly demand for good X, Qx, and obtains the parameter
estimates below from a multiple regression using the double-log model:
Px
Py
Pz
Intercept
3.402
Coefficients
-2.2
1.8
- 0.55
-0.8
t-statistics
4.12
2.73
2.09
- 7.54
where Px = price of good X, Py = price of good Y, P₂ = price of good Z, and I = monthly per capita
personal income. Also, multiple R² = 0.86, n = 20, and F-statistic = 17.08.
a) Using the above results, construct (write out) the estimated regression equation (i) in the
double log form, and, (ii) in the power or multiplicative function form.
b) Interpret and explain the coefficients of Py, P₂, and I.
c)
Assuming a 5% significance level (k = 0.05), determine the degrees of freedom and the
critical t-value. Perform t-tests on the parameter estimates for Py and P₂. Clearly and
explicitly state the hypotheses for each parameter that you are testing.
d) Assuming a 5% significance level (k = 0.05), perform an F-test on the entire regression.
Clearly and explicitly state the hypothesis that you are testing.
e) Explain the meaning of the multiple R². Briefly discuss the robustness of the estimated model,
i.e., how "good" is it?
Expert Solution
This question has been solved!
Explore an expertly crafted, step-by-step solution for a thorough understanding of key concepts.

This is a popular solution!

Trending now
This is a popular solution!

Step by step
Solved in 4 steps with 4 images

Recommended textbooks for you
College Algebra
Algebra
ISBN:
9781305115545
Author:
James Stewart, Lothar Redlin, Saleem Watson
Publisher:
Cengage Learning

Algebra & Trigonometry with Analytic Geometry
Algebra
ISBN:
9781133382119
Author:
Swokowski
Publisher:
Cengage

Algebra and Trigonometry (MindTap Course List)
Algebra
ISBN:
9781305071742
Author:
James Stewart, Lothar Redlin, Saleem Watson
Publisher:
Cengage Learning
College Algebra
Algebra
ISBN:
9781305115545
Author:
James Stewart, Lothar Redlin, Saleem Watson
Publisher:
Cengage Learning
Algebra & Trigonometry with Analytic Geometry
Algebra
ISBN:
9781133382119
Author:
Swokowski
Publisher:
Cengage
Algebra and Trigonometry (MindTap Course List)
Algebra
ISBN:
9781305071742
Author:
James Stewart, Lothar Redlin, Saleem Watson
Publisher:
Cengage Learning

Functions and Change: A Modeling Approach to Coll…
Algebra
ISBN:
9781337111348
Author:
Bruce Crauder, Benny Evans, Alan Noell
Publisher:
Cengage Learning