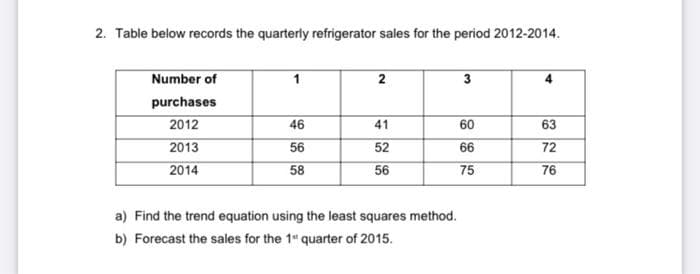
2. Table below records the quarterly refrigerator sales for the period 2012-2014. Number of 2 3 purchases 2012 46 41 60 63 2013 56 52 66 72 2014 58 56 75 76 a) Find the trend equation using the least squares method. b) Forecast the sales for the 1" quarter of 2015.


Q: The daily water level in Angat Dam is reported in batches of 30 day periods. During the dry season…
A:
Q: Because of the COVID-19 pandemic, online enrolment and a survey was conducted simultancously. There…
A: Please find the explanation below. Thank you
Q: a) One production process yielded 80 defective pieces in a random sample of size 400 while another…
A: Given that One production process yielded 80 defective pieces in a random sample of size 400 while…
Q: (a) The ministry of education is considering funding pre-school education. Before making their…
A: Since you asked multiple questions, we will solve the first question for you. If you want any…
Q: 5.1. The following output was obtained from a computer program that performed a two-factor ANOVA on…
A:
Q: You want to see if it makes a difference which lane to be in when there is traffic. You randomly…
A: The question is based on categorical data analysis Given : Random selected cars ( n ) = 296 Level of…
Q: In a large clinical trial, 397,626 children were randomly assigned to two groups. The treatment…
A: Given that Population size N =397626 Favorable cases x1=25 , x2=83
Q: Based on the Exercise 6.2(3), test the hypothesis concerning H, : B = 2 against the H : B, #2 at the…
A:
Q: 23. A sample of 250 male registered voters showed that 57% of them are in favour of higher taxes on…
A: The question is based on a confidence int. for difference between two popl. prop. Given : Confidence…
Q: TEACHER Weatherwae is a magatine pubiished by the American Meteorological Society. One issue grves a…
A: For the given data Perform t test for one mean
Q: In order to increase employment, France mandated that all companies with 20 or more employees reduce…
A: a) 90% Confidence interval for the Population Proportion We need to construct the 90% confidence…
Q: A nutritionist conducted a survey to study the blood pressure(mmHg) of 8 randomly selected patients…
A: Given data
Q: g. The p-value is Select an answer a h. Based on this, we should Select an answer i. Thus, the final…
A:
Q: a. Use the sample data with a 0.01 significance level to test the claim that for the population of…
A: aa) Use the Paired t test PAIRED-T TEST The dependent variable must be continuous. When data are…
Q: X is a normally distributed variable with a mean of 96 and a standard deviation of 10. Find the…
A:
Q: A statistics instructor gave a four-question true-false quiz to his class of 82 students. The…
A:
Q: 2. A standard deviation for a population is o = 12.6. A sample of 36 observations selected from this…
A:
Q: 11. Which level(s) of measurement is(are) considered quantitative? A. Interval and Nominal B. Ratio…
A: Here we have given the question about the levels of measurements. We have to identify which levels…
Q: Make 1 real-life problem with a solution in any of the following topics; 4. Preforming hypothesis…
A: If a random pattern length of eighty college students from School 1 well-known shows 19 college…
Q: Different groups of consumers are intercepted in shopping malls at the end of every month, for a…
A: Different consumers are intercepted in shopping malls every six months to examine soft drink…
Q: . Compute for the areas bounded by the following Z scores under a normal curve. Draw also the…
A:
Q: The standard deviation for a population is ? = 15.3. A sample of 36 observations selected from this…
A:
Q: Use the following 95% confidence interval to answer the following questions: (0.70, 0.80) what is…
A:
Q: 0.0021 84.64 What is the mean of the sampling distribution? 0.9982 Find the standard error of the…
A: Solution-: Given: μ=85,σ=2.2,n=64 We want to find, (a) What is mean of the sampling distribution?…
Q: who
A: Practical significance shows that the effect is large enough to be meaningful in the real world.…
Q: 12. It is the process of selecting a sample from a large group based on the principle of chance. A.…
A: A success of sampling method mainly depends upon proper selection of sampling method.
Q: 4. [6] University officials hope that changes made have improved the retention rate. In 2018, a…
A: Given Information: In the Year 2018; Total no. of freshman (n1)=2006No. of sophomores(a1)=1521 In…
Q: It has long been stated that the mean temperature of humans is 98.6°F. However, two researchers…
A:
Q: The numbers 1, 2, 3 and 4 are written separately on four slips of The slips are put in a box and…
A:
Q: 8,9,7, 6,4, 10, 15, 12, 11, 15, 16, 2, 1, 11, 12 Determine the Q1 and Q3 Find the D3 and D6 Find the…
A:
Q: The graph of the discrete probability to the right represents the number of live births by a mother…
A: Let x be the discrete random variable and it said to follows the probability mass fucntion with the…
Q: Which of the following statistics would be helpful for measuring dispersion? (the spread
A: Given problem Given that Which of the following statistics would be helpful for measuring…
Q: 98.6°F. They measured the temperatures of 56 health standard deviation of 1.1°F. Use the P-value…
A: There are 56 healthy adults; n=56 Sample mean is 98.4 and sample standard deviation is 1.1…
Q: a) Find a point estimate for the difference in average starting salaries for graduate economists and…
A: here given for Graduate Economist n1 = 80 x¯ = 48100 σ1 = 7200 (as mention in part b considered…
Q: C. KEEP PRACTICING: Read the situation carefully and an Dennis and Christine scored 32 and 23,…
A: Please find the explanation below. Thank you
Q: Investigation Results – Using the given data, investigate the possible relationships between Life…
A: Hello! As you have posted more than 3 sub parts, we are answering the first 3 sub-parts. In case…
Q: What is the point estimate, that you should use for determining sample size? Notice this is a pilot…
A: Let’s say that you work for a publication and would like to start your first pilot study. Your boss…
Q: ed or uncorrelated
A: Points x y sd(x) sd(y) A 3 4.5 0.02 0.015 B 4.25 4.25 0.023 0.036 C 5.5 5.5 0.033 0.028 D 8…
Q: What are the null and alternative hypotheses for the hypothesis test? OC. Ho: P, * P2 O A. Ho: P1…
A: Use the Two sample Proportion z test For sample 1, we have that the sample size is N1= 40 the…
Q: Dependent variable - Machine maintenance costs Independent variable - Machine hours Intercept…
A: What percentage of the variation in maintenance costs is explained by the independent variable?
Q: A government agency computed the proportion of U.S. residents who lived in each of four geographic…
A: For the given data State the Hypotheses
Q: i. Find E(T). You can use the mean of an exponential distribution without proof, but you need to…
A:
Q: Write the expressions for the following models a. AR(2) b. MA(2) c. ARMA(2,2) d. ARIMA(1,1,1)
A: (a) for an AR(2) process Xt Xt=ϕ1Xt-1+ϕ2Xt-2+Ztwhere Zt is a purely random process with mean 0 and…
Q: 2) Use the table of standard normal curve areas to find the following: a. The area less than az…
A:
Q: Are job applicants with easy to pronounce last names more likely to get called for an interview than…
A: There are two independent samples which are easy to pronounce and difficult to pronounce. We have to…
Q: Complete the table below with appropriate values
A: Given: Z X μ σ 150 108 12.8 -0.50 15 0.10 1.22 50 18 2.30 100 98.30 45 80 20
Q: What is the highest first-dose recipiency rate recorded in any zip code across the city? Type your…
A: Introduction: The "Zip Code", name of the "Borough", and the "First Dose" recipiency rate are given…
Q: For questions 15-20, use the following regression output obtained by regressing birth weight (the y…
A: For the given data Select the correct choice
Q: 940 930 920 910 900 890 880 870 50 100 Birth Weight (Ibs) 1. Birth Weight and Yearling Weight…
A:
Q: Listed below are systolic blood pressure measurements (mm Hg) taken from the right and left arms of…
A: The question is based on a paired sample t test Given : Level of signif. ( α ) = 0.05

Step by step
Solved in 2 steps

- Define the Distributed Lag Model with Additional Lags and AR(p) Errors?The shape of the mean-variance frontier that results from the combination of a riskless and arisky asset is…..:a. Is U-shaped, tilted 90 degrees clockwise.b. Is a straight line passing from the mean-variance points of the two assets.c. Is a hyperbola.d. Consists of two straight lines, each connecting one of the two assets to a risk-freeportfolioHow many indicator variables would be included in the model in order to prevent the least squares estimation from failing?
- Ex[lain the Two Stage Least Squares Estimator?If the data analyst hypothesizes that grocery sales are higher when payment is made using credit cards compared to cash payment, the null hypothesis would likely state that grocery sales are lower when payment is made using credit cards compared to cash payment. T/FExplain in detail the approach of Weighted Least Square used by applied economiststo address heteroskedasticity in empirical work.
- In terms of the model parameters, state the null hypothesis that, after controlling for sales and roe, ros has no effect on CEO salary. State the alternative that better stock market performance increases a CEO’s salary.It is about the differantial equations...Suppose that a firm can produce a part it uses for $520 per unit, with a fixed cost of $25,000. The company has been offered a contract from a supplier that allows it to purchase the part at a cost of $544 per unit, which includes transportation. The key outputs in the model are the difference in these costs and the decision that results in the lower cost. Assume that the production volume is uncertain. Suppose the manufacturer has enough data and information to estimate that the production volume will be normally distributed with a mean of 1,000 and a standard deviation of 85. Use a 100-trial Monte Carlo simulation to find the average cost difference and percent of trials that result in manufacturing or outsourcing as the best decision. Please include table showing both the cost difference and decision for each trial. Please include the Excel worksheet with all the details with your answer.
- Some financial theoreticians believe that the stock market’s daily prices constitute a “random walk with positive drift”. If this is accurate, then the Dow Jones Industrial average should show a gain on more than 50 percent of all trading days. If the average increased on 101 of 175 randomly chosen days, what do you think about the suggested theory? use a 0.01 level of significance.The researchers reported:" A 2x2 ANOVA revealed, first of all, a main effect for depletion, indicating that depleted individuals generated less ideas (M = 9.40, SD = 5.64) than non-depleted individuals (M = 12.44, SD = 7.34), F (1, 108) = 6.03, p = .016, n2 = .05. This effect was qualified by the expected interaction with [perseverance], F (1,108) = 4.52, p = .036, n2 = .05". What size are the effects for the main effect of depletion and for the interaction between depletion and perseverance, according to Cohen's conventions? a. These are small- to -medium effects b. These are non existent effects c. These are large effects d. We are unable to tell from from the n2 / r2 statisticsData released by the Department of Education regarding the rate (percentage) of ninth-grade students that don't graduate showed that out of 50 states, 11 states had an increase in the dropout rate during the past 2 years. 13 states had a dropout rate of at least 30% during the past 2 years. 21 states had an increase in the dropout rate and/or a dropout rate of at least 30% during the past 2 years. How many states had a dropout rate that was less than 30% but that had increased over the 2-year period?