TEACHER Weatherwae is a magatine pubiished by the American Meteorological Society. One issue grves a rating system used to classify Noreaster storms that frequently hit New England and can cause much damage near the ocean. A severe storm has an average peak wave height of16.4 feet for waves hitting the shore. Suppose that a Nor'easter is in progress at the severe storm class rating. Peak wave heights are usually measured from land (using binoculars) oft fived cement piers. Suppose that a reading of 40 waves showed an average wave height of 16.7 feet. Previous studies of severe storms indicate that 3.5 feet. Does this information suggest that the sterm is (perhaps temporarily) increasing above the severe rating? Use aw0.01. (0) What is the level of signitcance? State the null and alternate hypotheses Hel 16.4 , H 164 M 16.4 , H 164R Motw16.4 H 164n M 16.4 , H 16.4 M 164 ; H 16.4n (b) What sampling distribution will you use? Explain the rationale for your choice of sampling distribution O The Student's t, since the sample size is large and e is known OThe standard normal, since the sample sre is large andeis unknown The Student's t since the sample sei large and is unknown O The standard normal, unce the sample size is large and ais known What is the value of the sample test statistic? (Round your answer to two decimal places)
TEACHER Weatherwae is a magatine pubiished by the American Meteorological Society. One issue grves a rating system used to classify Noreaster storms that frequently hit New England and can cause much damage near the ocean. A severe storm has an average peak wave height of16.4 feet for waves hitting the shore. Suppose that a Nor'easter is in progress at the severe storm class rating. Peak wave heights are usually measured from land (using binoculars) oft fived cement piers. Suppose that a reading of 40 waves showed an average wave height of 16.7 feet. Previous studies of severe storms indicate that 3.5 feet. Does this information suggest that the sterm is (perhaps temporarily) increasing above the severe rating? Use aw0.01. (0) What is the level of signitcance? State the null and alternate hypotheses Hel 16.4 , H 164 M 16.4 , H 164R Motw16.4 H 164n M 16.4 , H 16.4 M 164 ; H 16.4n (b) What sampling distribution will you use? Explain the rationale for your choice of sampling distribution O The Student's t, since the sample size is large and e is known OThe standard normal, since the sample sre is large andeis unknown The Student's t since the sample sei large and is unknown O The standard normal, unce the sample size is large and ais known What is the value of the sample test statistic? (Round your answer to two decimal places)

Mathematics For Machine Technology
8th Edition
ISBN:9781337798310
Author:Peterson, John.
Publisher:Peterson, John.
Chapter29: Tolerance, Clearance, And Interference
Section: Chapter Questions
Problem 16A: Spacers are manufactured to the mean dimension and tolerance shown in Figure 29-12. An inspector...

Related questions
Question
Transcribed Image Text:TEACHER
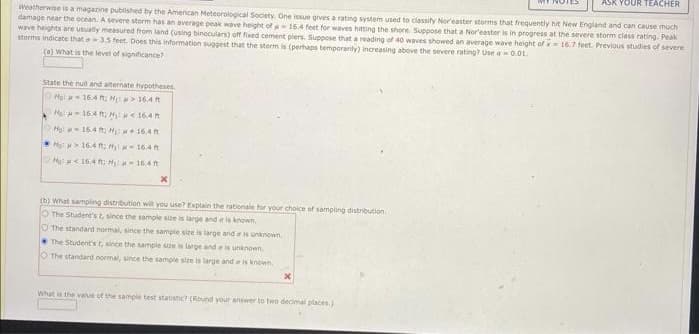
Weatherwse is a magazine pubilished by the American Meteorological Soclety. One issue grves a rating system used to classity Nor'easter storms that frequently hit New England and can cause much
damage near the ocean. A severe storm has an average peak wave height of 16.4 feet for waves hitting the shore. Suppose that a Nor'easter is in progress at the severe storm class rating. Peak
wave heights are usually measured from land (using binoculars) off fixed cement piers. Suppose that a reading of 40 waves showed an average wave height of x 16.7 feet. Previous studies of severe
storms indicate that 35 feet. Does this information suggest that the storm is (perhaps temporarily) increasing above the severe rating? Use 0.01.
(a) What is the level of significance?
State the nul and alternate hypotheses
Hel 16.4 Ht >16.4 t
Mo 16.4 t, H< 164R
Ho: - 16.4 t, H 16.4 R
Hot 16.4 n; H- 16.4 t
H < 16.4 n; H- 164n
(b) What sampling distribution will you use? Explain the rationale for your choice of sampling distribution.
OThe Student's t, since the sample size is large and is known.
OThe standard normal, since the sampie size is large ande is unknown
The Student's t since the sample stze is large and eis unknoen.
O The standard normal, since the sample size is large and as known
What is the value of the sample test statistic? (Round your answer to two decimal places)
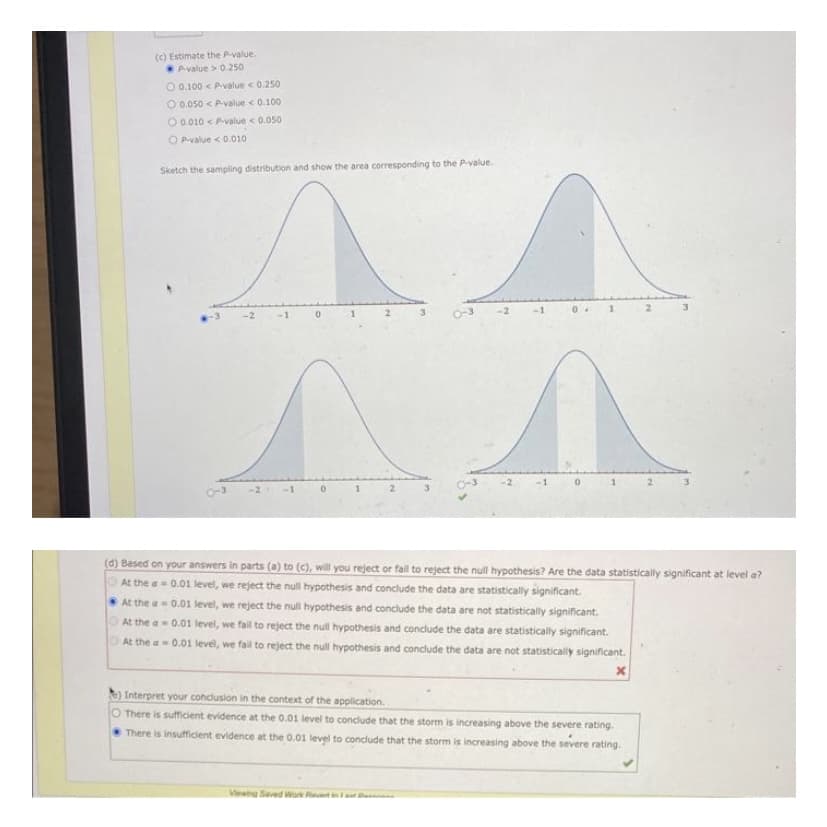
Transcribed Image Text:(c) Estimate the P-value.
Avalue > 0.250
O 0.100 < Pvalue <0.250
O 0.050 < P-value < 0.100
O 0.010 <Pvalue < 0.050
O Pvalue < 0.010
Sketch the sampling distribution and show the area corresponding to the P-value.
2.
o-3
-1
-2
-2
(d) Based on your answers in parts (a) to (c), will you reject or fail to reject the null hypothesis? Are the data statistically significant at level a?
At the a = 0.01 level, we reject the null hypothesis and conclude the data are statistically significant.
At the a 0.01 level, we reject the null hypothesis and conclude the data are not statistically significant.
At the a - 0.01 level, we fail to reject the null hypothesis and conclude the data are statistically significant.
At the a-0.01 level, we fail to reject the null hypothesis and conclude the data are not statistically significant.
) Interpret your conclusion in the context of the application.
O There is sufficient evidence at the 0.01 level to conclude that the storm is increasing above the severe rating.
There is insufficient evidence at the 0.01 level to conclude that the storm is increasing above the severe rating.
Viewing Saved Work Ret t
Expert Solution
This question has been solved!
Explore an expertly crafted, step-by-step solution for a thorough understanding of key concepts.

Step by step
Solved in 2 steps with 1 images

Recommended textbooks for you
Mathematics For Machine Technology
Advanced Math
ISBN:
9781337798310
Author:
Peterson, John.
Publisher:
Cengage Learning,

Glencoe Algebra 1, Student Edition, 9780079039897…
Algebra
ISBN:
9780079039897
Author:
Carter
Publisher:
McGraw Hill

Elementary Geometry For College Students, 7e
Geometry
ISBN:
9781337614085
Author:
Alexander, Daniel C.; Koeberlein, Geralyn M.
Publisher:
Cengage,
Mathematics For Machine Technology
Advanced Math
ISBN:
9781337798310
Author:
Peterson, John.
Publisher:
Cengage Learning,
Glencoe Algebra 1, Student Edition, 9780079039897…
Algebra
ISBN:
9780079039897
Author:
Carter
Publisher:
McGraw Hill
Elementary Geometry For College Students, 7e
Geometry
ISBN:
9781337614085
Author:
Alexander, Daniel C.; Koeberlein, Geralyn M.
Publisher:
Cengage,