A government agency computed the proportion of U.S. residents who lived in each of four geographic regions in a particular year. Then a simple random sample was drawn of 1000 people living in the United States in the current year. The following table presents the results. Past Year Observed Region Proportion Counts Northeast 0.181 152 Midwest 0.248 227 South 0.343 390 West 0.228 231 Send data to Excel Can you conclude that the proportions of people living in the various regions changed between the current year and the past year? Use the 0.01 level of significance and the P-value method with the TI-84 Plus calculator. Part: 0 / 4 Part 1 of 4 (a) State the null and alternate hypotheses. Ho: The proportions of U.S. residents who lived in each geographic region in the past year (Choose one) ▼ the same as those in the current year. H: The proportions of U.S. residents who lived in each geographic region in the past year (Choose one) ▼ the same as those in the current year.
A government agency computed the proportion of U.S. residents who lived in each of four geographic regions in a particular year. Then a simple random sample was drawn of 1000 people living in the United States in the current year. The following table presents the results. Past Year Observed Region Proportion Counts Northeast 0.181 152 Midwest 0.248 227 South 0.343 390 West 0.228 231 Send data to Excel Can you conclude that the proportions of people living in the various regions changed between the current year and the past year? Use the 0.01 level of significance and the P-value method with the TI-84 Plus calculator. Part: 0 / 4 Part 1 of 4 (a) State the null and alternate hypotheses. Ho: The proportions of U.S. residents who lived in each geographic region in the past year (Choose one) ▼ the same as those in the current year. H: The proportions of U.S. residents who lived in each geographic region in the past year (Choose one) ▼ the same as those in the current year.

Glencoe Algebra 1, Student Edition, 9780079039897, 0079039898, 2018
18th Edition
ISBN:9780079039897
Author:Carter
Publisher:Carter
Chapter10: Statistics
Section10.5: Comparing Sets Of Data
Problem 14PPS

Related questions
Question
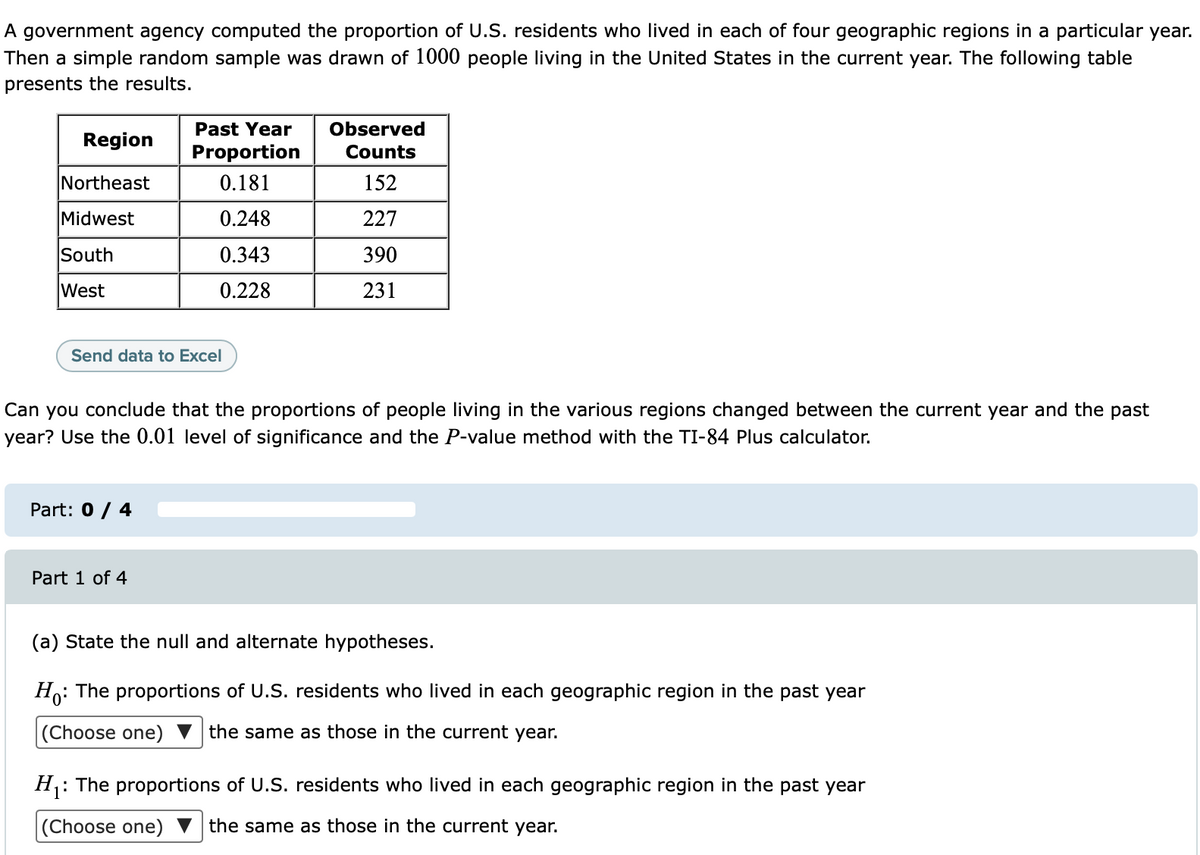
Transcribed Image Text:A government agency computed the proportion of U.S. residents who lived in each of four geographic regions in a particular year.
Then a simple random sample was drawn of 1000 people living in the United States in the current year. The following table
presents the results.
Past Year
Observed
Region
Proportion
Counts
Northeast
0.181
152
Midwest
0.248
227
South
0.343
390
West
0.228
231
Send data to Excel
Can you conclude that the proportions of people living in the various regions changed between the current year and the past
year? Use the 0.01 level of significance and the P-value method with the TI-84 Plus calculator.
Part: 0 / 4
Part 1 of 4
(a) State the null and alternate hypotheses.
Ho: The proportions of U.S. residents who lived in each geographic region in the past year
(Choose one) ▼ the same as those in the current year.
H: The proportions of U.S. residents who lived in each geographic region in the past year
(Choose one)
the same as those in the current year.
Expert Solution
This question has been solved!
Explore an expertly crafted, step-by-step solution for a thorough understanding of key concepts.

This is a popular solution!

Trending now
This is a popular solution!

Step by step
Solved in 2 steps with 1 images

Recommended textbooks for you
Glencoe Algebra 1, Student Edition, 9780079039897…
Algebra
ISBN:
9780079039897
Author:
Carter
Publisher:
McGraw Hill

College Algebra (MindTap Course List)
Algebra
ISBN:
9781305652231
Author:
R. David Gustafson, Jeff Hughes
Publisher:
Cengage Learning
Glencoe Algebra 1, Student Edition, 9780079039897…
Algebra
ISBN:
9780079039897
Author:
Carter
Publisher:
McGraw Hill
College Algebra (MindTap Course List)
Algebra
ISBN:
9781305652231
Author:
R. David Gustafson, Jeff Hughes
Publisher:
Cengage Learning