2. The following data were obtained from the liquid and plastic limit tests for a soil: Liquid Limit Test: Moisture content, w% 32.35 31.55 31.35 33.62 33.00 Number of blows, N 22 29 32 16 19.00 Plastic Limit Test: Moisture content 20.62% a) Draw the flow curve from the liquid limit test data and find the liquid limit. (use excel to graph) b) What is the plasticity index of the soil?
2. The following data were obtained from the liquid and plastic limit tests for a soil: Liquid Limit Test: Moisture content, w% 32.35 31.55 31.35 33.62 33.00 Number of blows, N 22 29 32 16 19.00 Plastic Limit Test: Moisture content 20.62% a) Draw the flow curve from the liquid limit test data and find the liquid limit. (use excel to graph) b) What is the plasticity index of the soil?

Principles of Geotechnical Engineering (MindTap Course List)
9th Edition
ISBN:9781305970939
Author:Braja M. Das, Khaled Sobhan
Publisher:Braja M. Das, Khaled Sobhan
Chapter9: In Situ Stresses
Section: Chapter Questions
Problem 9.11P

Related questions
Question
Transcribed Image Text:Problem Set 4
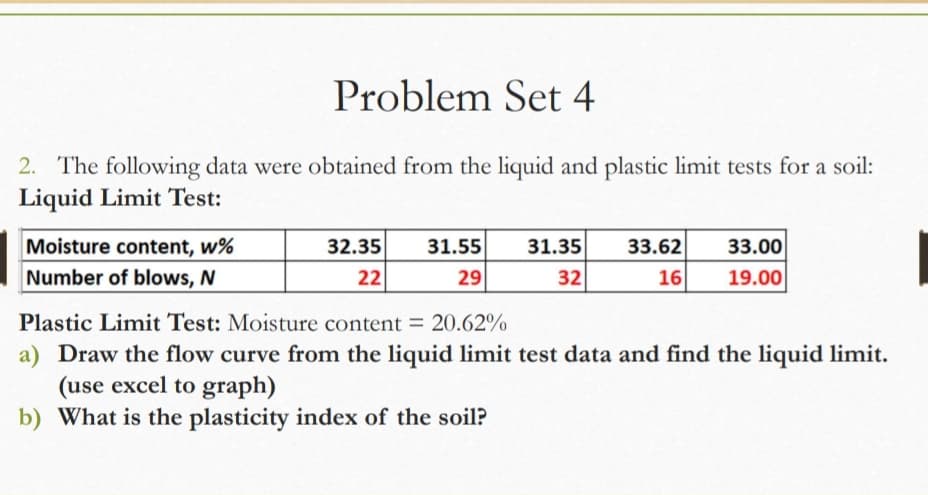
2. The following data were obtained from the liquid and plastic limit tests for a soil:
Liquid Limit Test:
Moisture content, w%
32.35
31.55
31.35
33.62
33.00
Number of blows, N
22
29
32
16
19.00
Plastic Limit Test: Moisture content = 20.62%
a) Draw the flow curve from the liquid limit test data and find the liquid limit.
(use excel to graph)
b) What is the plasticity index of the soil?
Expert Solution
This question has been solved!
Explore an expertly crafted, step-by-step solution for a thorough understanding of key concepts.

Step by step
Solved in 2 steps with 2 images

Recommended textbooks for you
Principles of Geotechnical Engineering (MindTap C…
Civil Engineering
ISBN:
9781305970939
Author:
Braja M. Das, Khaled Sobhan
Publisher:
Cengage Learning
Principles of Geotechnical Engineering (MindTap C…
Civil Engineering
ISBN:
9781305970939
Author:
Braja M. Das, Khaled Sobhan
Publisher:
Cengage Learning