2. Using Excel to draw a scatter diagram. Treat the percentage change in the S&P500 as the independent variable and the percentage change in the stock you chose
2. Using Excel to draw a scatter diagram. Treat the percentage change in the S&P500 as the independent variable and the percentage change in the stock you chose

Glencoe Algebra 1, Student Edition, 9780079039897, 0079039898, 2018
18th Edition
ISBN:9780079039897
Author:Carter
Publisher:Carter
Chapter10: Statistics
Section10.6: Summarizing Categorical Data
Problem 23PPS

Related questions
Question
Step by step solution for number 2 question.
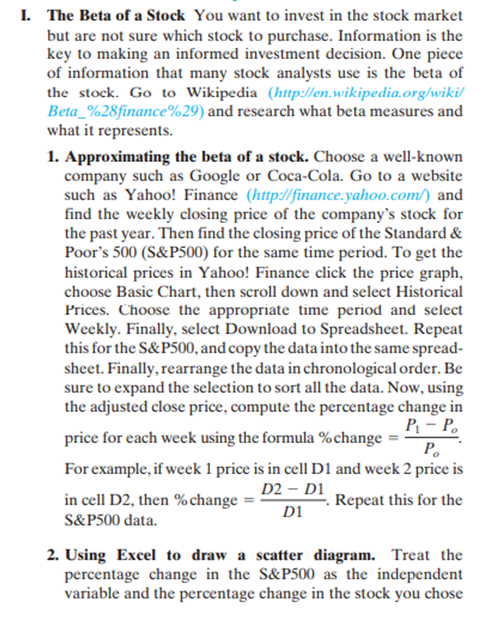
Transcribed Image Text:I. The Beta of a Stock You want to invest in the stock market
but are not sure which stock to purchase. Information is the
key to making an informed investment decision. One piece
of information that many stock analysts use is the beta of
the stock. Go to Wikipedia (http://en.wikipedia.org/wiki/
Beta_%28finance%29) and research what beta measures and
what it represents.
1. Approximating the beta of a stock. Choose a well-known
company such as Google or Coca-Cola. Go to a website
such as Yahoo! Finance (http://finance.yahoo.com/) and
find the weekly closing price of the company's stock for
the past year. Then find the closing price of the Standard &
Poor's 500 (S&P500) for the same time period. To get the
historical prices in Yahoo! Finance click the price graph,
choose Basic Chart, then scroll down and select Historical
Prices. Choose the appropriate time period and select
Weekly. Finally, select Download to Spreadsheet. Repeat
this for the S&P500, and copy the data into the same spread-
sheet. Finally, rearrange the data in chronological order. Be
sure to expand the selection to sort all the data. Now, using
the adjusted close price, compute the percentage change in
Р. - Р.
price for each week using the formula %change
P.
For example, if week 1 price is in cell D1 and week 2 price is
D2 – D1
in cell D2, then % change
Repeat this for the
Di
S&P500 data.
2. Using Excel to draw a scatter diagram. Treat the
percentage change in the S&P500 as the independent
variable and the percentage change in the stock you chose
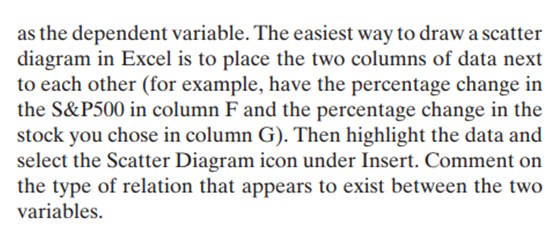
Transcribed Image Text:as the dependent variable. The easiest way to draw a scatter
diagram in Excel is to place the two columns of data next
to each other (for example, have the percentage change in
the S&P500 in column F and the percentage change in the
stock you chose in column G). Then highlight the data and
select the Scatter Diagram icon under Insert. Comment on
the type of relation that appears to exist between the two
variables.
Expert Solution
This question has been solved!
Explore an expertly crafted, step-by-step solution for a thorough understanding of key concepts.

This is a popular solution!

Trending now
This is a popular solution!

Step by step
Solved in 3 steps with 2 images

Recommended textbooks for you
Glencoe Algebra 1, Student Edition, 9780079039897…
Algebra
ISBN:
9780079039897
Author:
Carter
Publisher:
McGraw Hill

Big Ideas Math A Bridge To Success Algebra 1: Stu…
Algebra
ISBN:
9781680331141
Author:
HOUGHTON MIFFLIN HARCOURT
Publisher:
Houghton Mifflin Harcourt

Holt Mcdougal Larson Pre-algebra: Student Edition…
Algebra
ISBN:
9780547587776
Author:
HOLT MCDOUGAL
Publisher:
HOLT MCDOUGAL
Glencoe Algebra 1, Student Edition, 9780079039897…
Algebra
ISBN:
9780079039897
Author:
Carter
Publisher:
McGraw Hill
Big Ideas Math A Bridge To Success Algebra 1: Stu…
Algebra
ISBN:
9781680331141
Author:
HOUGHTON MIFFLIN HARCOURT
Publisher:
Houghton Mifflin Harcourt
Holt Mcdougal Larson Pre-algebra: Student Edition…
Algebra
ISBN:
9780547587776
Author:
HOLT MCDOUGAL
Publisher:
HOLT MCDOUGAL