2. What type of graph would you use to display the data in this table? Number of Stolen Bicycles in One Month in Selected Cities North Bay Hamilton Barrie Guelph 153 Ottawa Toronto City Bicycles stolen 190 45 65 874 90 b. Circle graph Bar graph d. Scatter plot a. Histogram С.
2. What type of graph would you use to display the data in this table? Number of Stolen Bicycles in One Month in Selected Cities North Bay Hamilton Barrie Guelph 153 Ottawa Toronto City Bicycles stolen 190 45 65 874 90 b. Circle graph Bar graph d. Scatter plot a. Histogram С.

Glencoe Algebra 1, Student Edition, 9780079039897, 0079039898, 2018
18th Edition
ISBN:9780079039897
Author:Carter
Publisher:Carter
Chapter10: Statistics
Section10.2: Representing Data
Problem 15PPS

Related questions
Question
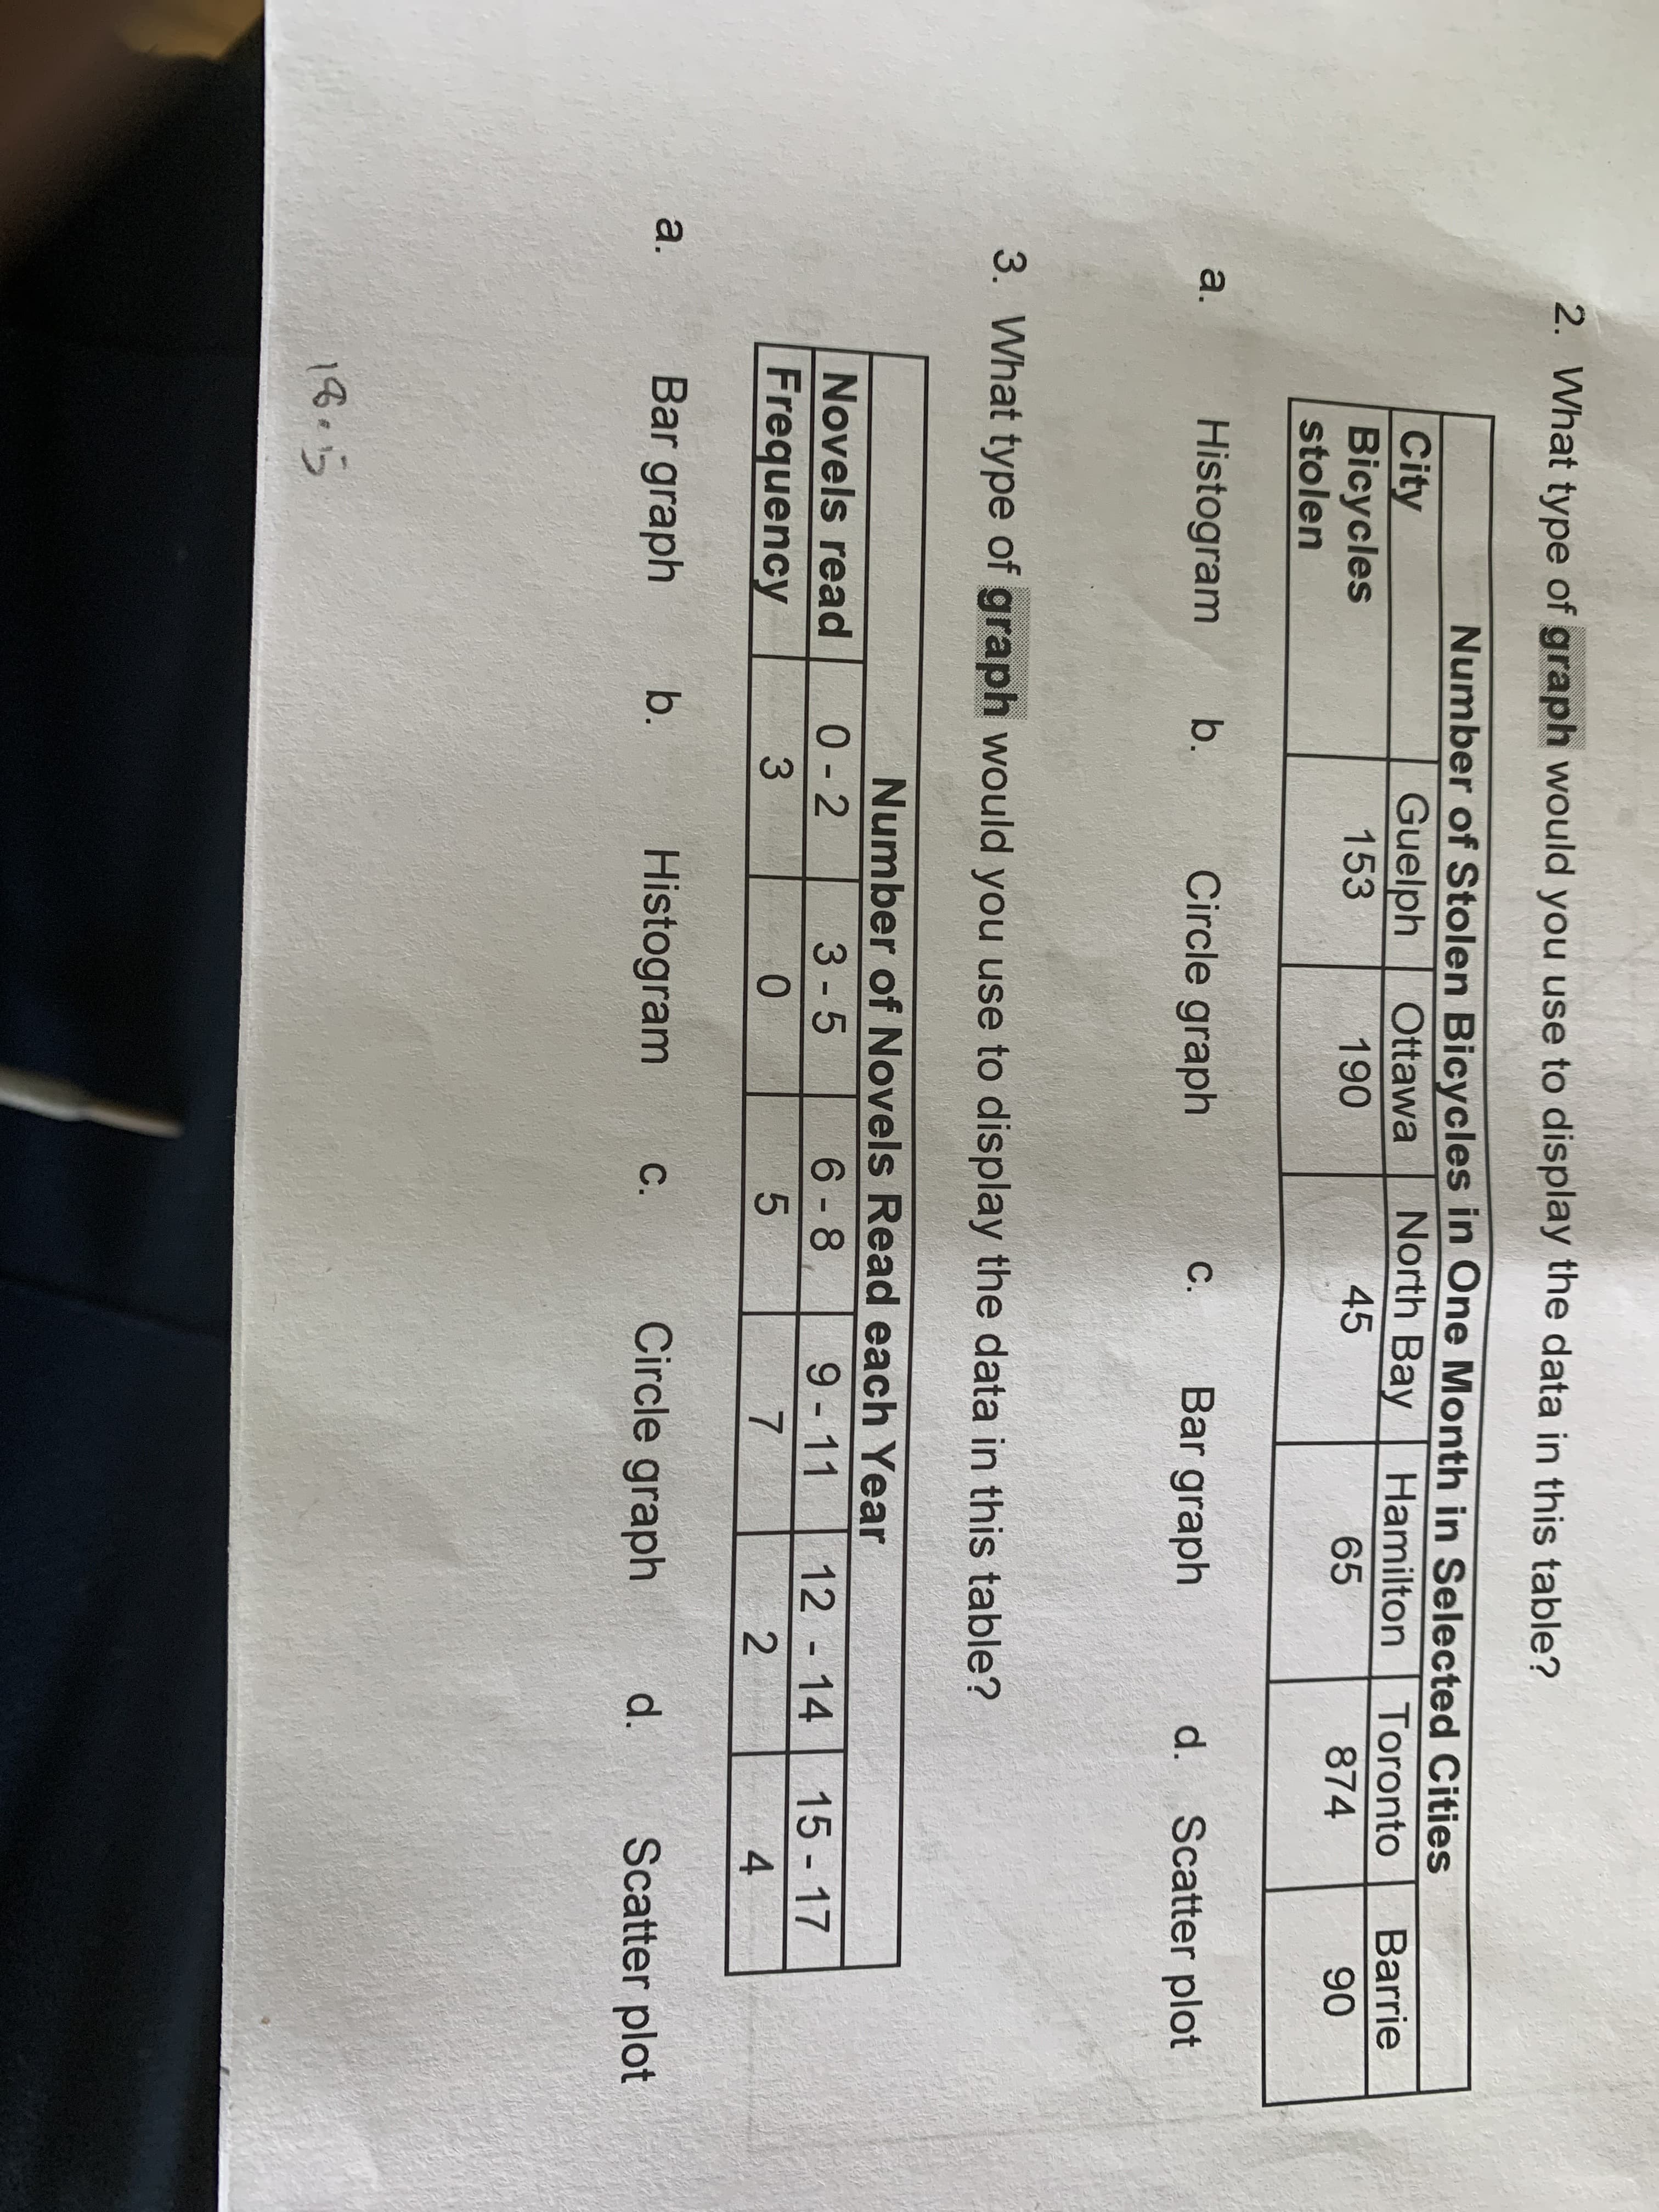
Transcribed Image Text:2. What type of graph would you use to display the data in this table?
Number of Stolen Bicycles in One Month in Selected Cities
North Bay
Hamilton
Barrie
Guelph
153
Ottawa
Toronto
City
Bicycles
stolen
190
45
65
874
90
b.
Circle graph
Bar graph
d. Scatter plot
a.
Histogram
С.
Expert Solution
This question has been solved!
Explore an expertly crafted, step-by-step solution for a thorough understanding of key concepts.

This is a popular solution!

Trending now
This is a popular solution!

Step by step
Solved in 3 steps

Recommended textbooks for you
Glencoe Algebra 1, Student Edition, 9780079039897…
Algebra
ISBN:
9780079039897
Author:
Carter
Publisher:
McGraw Hill

Algebra: Structure And Method, Book 1
Algebra
ISBN:
9780395977224
Author:
Richard G. Brown, Mary P. Dolciani, Robert H. Sorgenfrey, William L. Cole
Publisher:
McDougal Littell

Holt Mcdougal Larson Pre-algebra: Student Edition…
Algebra
ISBN:
9780547587776
Author:
HOLT MCDOUGAL
Publisher:
HOLT MCDOUGAL
Glencoe Algebra 1, Student Edition, 9780079039897…
Algebra
ISBN:
9780079039897
Author:
Carter
Publisher:
McGraw Hill
Algebra: Structure And Method, Book 1
Algebra
ISBN:
9780395977224
Author:
Richard G. Brown, Mary P. Dolciani, Robert H. Sorgenfrey, William L. Cole
Publisher:
McDougal Littell
Holt Mcdougal Larson Pre-algebra: Student Edition…
Algebra
ISBN:
9780547587776
Author:
HOLT MCDOUGAL
Publisher:
HOLT MCDOUGAL