2. You want to know if a nurse's absences from work in one month (Y) can be predicted by knowing her score on a test of psychological "bumout" (X). Burnout Absences Participant 2. 4 4. 8. 7. 7. 10 11 Given: EX'-212 EY'-ss2 EXY-317 a. Compute the statistic that describes the relationship. b What is the proportion of variance account for? Calculate and include an interpretation of the value-what does it tell us about the relationship between burnout and absences?
2. You want to know if a nurse's absences from work in one month (Y) can be predicted by knowing her score on a test of psychological "bumout" (X). Burnout Absences Participant 2. 4 4. 8. 7. 7. 10 11 Given: EX'-212 EY'-ss2 EXY-317 a. Compute the statistic that describes the relationship. b What is the proportion of variance account for? Calculate and include an interpretation of the value-what does it tell us about the relationship between burnout and absences?

Trigonometry (MindTap Course List)
10th Edition
ISBN:9781337278461
Author:Ron Larson
Publisher:Ron Larson
Chapter6: Topics In Analytic Geometry
Section6.4: Hyperbolas
Problem 5ECP: Repeat Example 5 when microphone A receives the sound 4 seconds before microphone B.

Related questions
Topic Video
Question
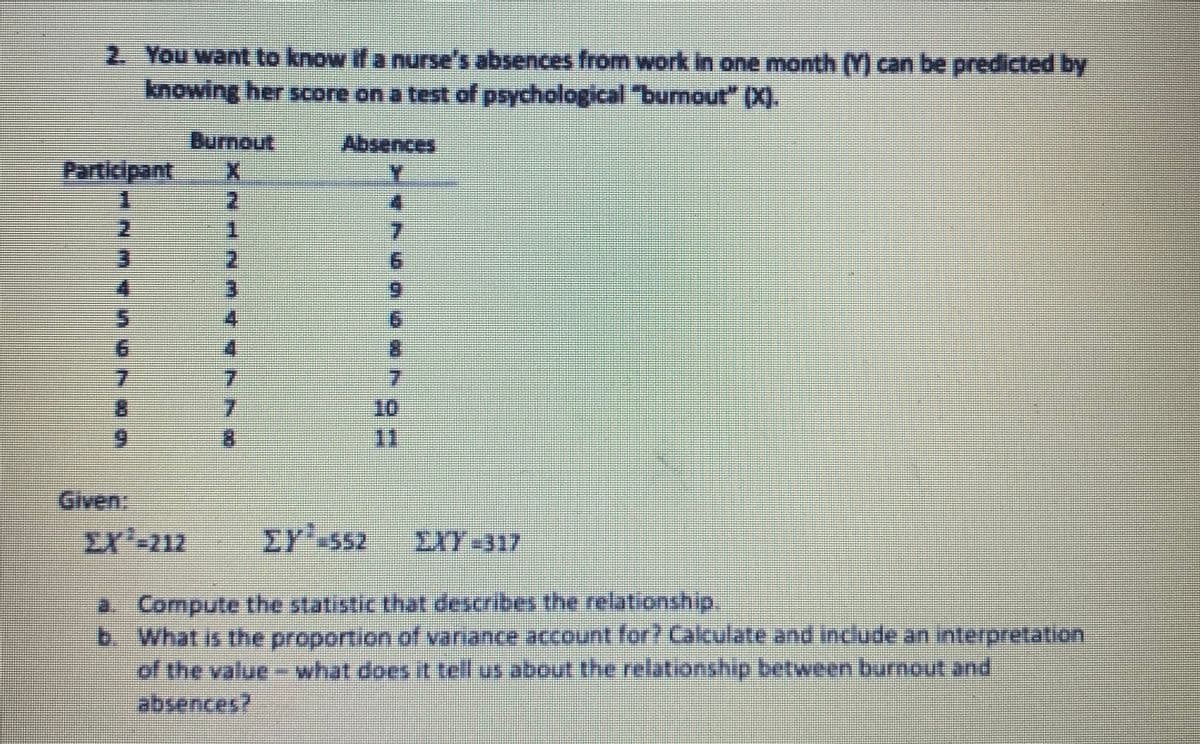
Transcribed Image Text:2. You want to know if a nurse's absences from work in one month (Y) can be predicted by
knowing her score on a test of psychological "bunout" (X).
Burnout
Participant
Absences
Y.
1.
2.
2.
9.
4.
6.
4.
9.
7.
7.
7.
7.
8.
11
Given:
Er'-212
EY' 552
EXY-317
a Compute the statistic that describes the relationship.
b. What is the proportion of vanance account for? Calculate and incdude an interpretation
of the value- what does it tell us about the relationship between burnout and
absences?
Expert Solution
This question has been solved!
Explore an expertly crafted, step-by-step solution for a thorough understanding of key concepts.

This is a popular solution!

Trending now
This is a popular solution!

Step by step
Solved in 3 steps

Knowledge Booster


Learn more about
Need a deep-dive on the concept behind this application? Look no further. Learn more about this topic, statistics and related others by exploring similar questions and additional content below.Recommended textbooks for you
Trigonometry (MindTap Course List)
Trigonometry
ISBN:
9781337278461
Author:
Ron Larson
Publisher:
Cengage Learning
Trigonometry (MindTap Course List)
Trigonometry
ISBN:
9781337278461
Author:
Ron Larson
Publisher:
Cengage Learning