In an experiment, 18 babies were asked to watch a climber attempt to ascend a hill. On two occasions, the baby witnesses the climber fail to make the climb. Then, the baby witnesses either a helper toy push the climber up the hill, or a hinderer preventing the climber from making the ascent. The toys were shown to each baby in a random fashion A second part of this experiment showed the climber approach the helper toy, which is not a surprising action, and then the climber approac hinderer toy, which is a surprising action. The amount of time the baby watched each event was recorded. The mean difference in time spent watching the climber approach the hinderer toy versus watching the climber approach the helper toy wa seconds with a standard deviation of 1.86 seconds Complete parts (a) through (c) Click the icon to view the table of critical 1-values CD (a) state the nut and alternative hypotheses to determine if babies tend to look at the ninderer toy longer than the neper toy Let Phinderer Phelper where Phinder the population mean time babies spend watching the cimber approach the and is the population mean time babies spend watching the climber approach the helper toy Ho Pa H₂ Pa (b) Assuming the differences are normally distributed with no outiers, test if the difference in the amount of time the baby will watch the hinderer toy versus the helper toy is greater than 0 at the 0.05 level of significance Find the test statistic for this hypothesis test Round to two decimal places as needed) Determine the critical value for this hypothesis test (Use a comma to separate answers as needed Round to two decimal places as needed)
In an experiment, 18 babies were asked to watch a climber attempt to ascend a hill. On two occasions, the baby witnesses the climber fail to make the climb. Then, the baby witnesses either a helper toy push the climber up the hill, or a hinderer preventing the climber from making the ascent. The toys were shown to each baby in a random fashion A second part of this experiment showed the climber approach the helper toy, which is not a surprising action, and then the climber approac hinderer toy, which is a surprising action. The amount of time the baby watched each event was recorded. The mean difference in time spent watching the climber approach the hinderer toy versus watching the climber approach the helper toy wa seconds with a standard deviation of 1.86 seconds Complete parts (a) through (c) Click the icon to view the table of critical 1-values CD (a) state the nut and alternative hypotheses to determine if babies tend to look at the ninderer toy longer than the neper toy Let Phinderer Phelper where Phinder the population mean time babies spend watching the cimber approach the and is the population mean time babies spend watching the climber approach the helper toy Ho Pa H₂ Pa (b) Assuming the differences are normally distributed with no outiers, test if the difference in the amount of time the baby will watch the hinderer toy versus the helper toy is greater than 0 at the 0.05 level of significance Find the test statistic for this hypothesis test Round to two decimal places as needed) Determine the critical value for this hypothesis test (Use a comma to separate answers as needed Round to two decimal places as needed)

Algebra & Trigonometry with Analytic Geometry
13th Edition
ISBN:9781133382119
Author:Swokowski
Publisher:Swokowski
Chapter10: Sequences, Series, And Probability
Section10.8: Probability
Problem 43E

Related questions
Question
Transcribed Image Text:Fier
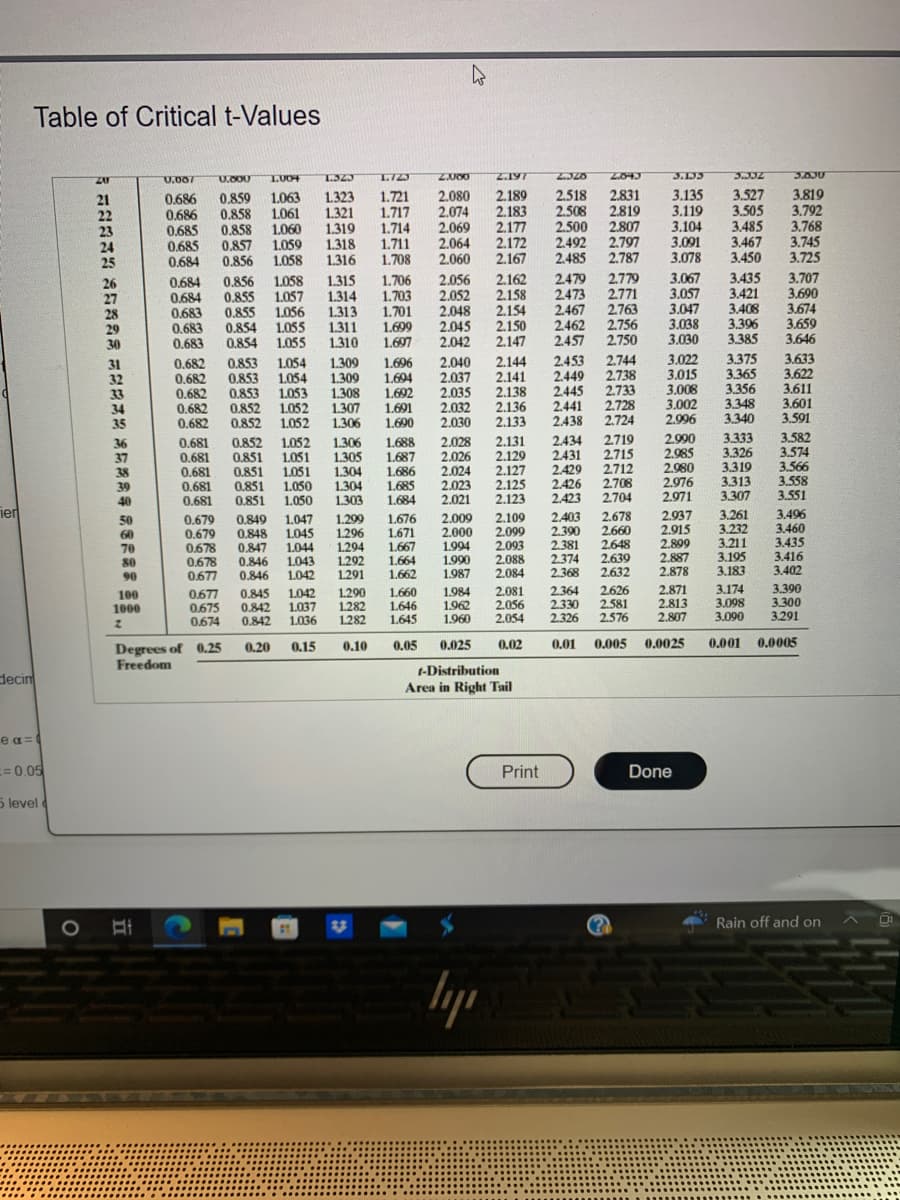
Table of Critical t-Values
0.007
0.000
1.004
2.320
3.135
3.352
3.135
3.527
3.119 3.505
3.104 3.485
3.467
3.450
3.067 3.435
1.323 1.723 2.000 2.197
2043
0.859 1.063
0.686
1.323 1.721 2.080 2.189 2.518 2.831
0.686 0.858 1.061 1.321 1.717 2.074 2.183
2.508
2.819
0.858 1.060 1.319 1.714 2.069
0.685
2.177 2.500 2.807
0.685 0.857 1.059 1.318 1.711 2.064 2.172 2.492 2.797 3.091
0.684 0.856 1.058 1.316 1.708 2.060 2.167 2.485 2.787 3.078
0.856 1.058 1.315 1.706 2.056 2.162 2.479 2.779
0.855 1.057 1.314 1.703 2.052 2.158 2.473 2.771
0.683 0.855 1.056 1.313 1.701 2.048 2.154 2.467 2.763 3.047
0.683 0.854 1.055 1.311 1.699 2.045 2.150 2.462 2.756
0.683 0.854 1.055 1.310 1.697 2.042 2.147 2.457 2.750
1.309
1.054
1.696 2.040 2.144 2.453 2.744
1.054 1.309
2.037
1.694
2.141 2.449 2.738
1.308 1.692 2.035 2.138 2.445 2.733
1.307 1.691 2.032 2.136
1.690
1.306
2.030 2.133
0.684
0.684
3.057 3.421
3.408
3.038
3.396
3.030
3.385
Skande
0.682 0.853
3.022
3.375
0.682
3.015
3.365
0.853
0.682 0.853 1.053
3.008
3.356
0.682 0.852 1.052
2.441 2.728
3.002
3.348
0.682 0.852
2.438 2.724
2.996
3.340
1.052
1.052
Ter
0.681
0.852
1.306 1.688
2.028
2.131
2.434
2.719
2.990
3.333
0.681 0.851 1.051
2.129
2.431
2.715
2.985
3.326
0.681 0.851 1.051
2.127 2.429
2.712 2.980
3.319
0.681
0.851
2.976
3.313
1.050
1.050
0.681 0.851
1.687
1.305
2.026
1.304 1.686 2.024
1.304
2.023
1.685
2.125
1.303 1.684 2.021 2.123
1.299 1.676 2.009 2.109
2.099
1.671 2.000
2.971
3.307
0.679 0.849
2.937 3.261
0.679 0.848
1.047
1.045
1.044
2.915
3.232
1.296
1.294
0.678 0.847
1.667
1.994
2.093
2.899
3.211
0.678 0.846
1.043
1.292 1.664
1.990
2.088
2.887
3.195
0.677
0.846
1.042
1.291
1.662 1.987
2,084
2.878
3.183
0.677
0.845
1.042
1.290
1.660
1.984 2.081
2.871
3.174
0.675
0.842
1.037
1.282
1.646
1.962
2.056
2.813 3.098
0.674
0.842
1.036
1.282
1.645
1.960
2,054
2.807
3.090
0.25
0.20
0.15
0.10
0.05
0.025
0.02
0.001
0.0025
t-Distribution
Area in Right Tail
decim
e α=
==0.05
5 level
358833 *5*2 =2222 588 *****.
1000
2
Degrees of
Freedom
OH
EN
lyr
Print
2.708
2.426
2.423 2.704
2.403 2.678
2.390 2.660
2.381
2.648
2.374
2.639
2.368
2.632
2.364
2.626
2.330
2.581
2.326
2.576
0.01
0.005
23
Done
F
3.03U
3.819
3.792
3.768
3.745
3.725
3.707
3.690
3.674
3.659
3.646
Pay
3.633
3.622
3.611
3.601
3.591
3.582
3.574
3.566
3.558
3.551
3.496
3.460
3.435
3.416
3.402
3.390
3.300
3.291
0.0005
Rain off and on
01

Transcribed Image Text:tab
caps lock
you
In an experiment, 18 babies were asked to watch a climber attempt to ascend a hill. On two occasions, the baby witnesses the climber fail to make the climb. Then, the baby witnesses either a helper toy push the climber up the hill, or a hinderer toy
preventing the climber from making the ascent. The toys were shown to each baby in a random fashion. A second part of this experiment showed the climber approach the helper toy, which is not a surprising action, and then the climber approached the
hinderer toy, which is a surprising action. The amount of time the baby watched each event was recorded. The mean difference in time spent watching the climber approach the hinderer toy versus watching the climber approach the helper toy was 1.06
seconds with a standard deviation of 1.86 seconds Complete parts (a) through (c).
Click the icon to view the table of critical t-values
(a) state the nut and alternative hypotheses to determine if babies tend to look at the hinderer toy longer than the neper toy. Let Phinderer-Phelper where Phinderers the population mean time babies spend watching the camber approach the hinderer toy
and is the population mean time babies spend watching the climber approach the helper toy.
Ho Po
H₂ Po
T
(b) Assuming the differences are normally distributed with no outiers, test if the difference in the amount of time the baby will watch the hinderer toy versus the helper toy is greater than 0 at the 0.05 level of significance
Find the test statistic for this hypothesis test
(Round to two decimal places as needed)
Determine the critical value for this hypothesis test
7
(Use a comma to separate answers as needed Round to two decimal places as needed)
D
State the conclusion for this hypothesis test
OA Do not reject H₂ There is not sufficient evidence at the a-0.05 level of significance to conclude that the difference is greater than 0.
OB. Do not reject H, There is sufficient evidence at the a-005 level of significance to conclude that the difference is greater than 0.
OC. Reject H₂ There is sufficient evidence at the a 0.05 level of significance to conclude that the difference is greater than 0.
OD. Reject H₂ There is not sufficient evidence at the a-005 level of significance to conclude that the difference is greater than 0
Type here to search
O E
Rain off and on
ly
esc
14
→1
"
Q
2
A
Z
2
W
S
#
*
X
3
$
E
D
D
C
a
4
R
F
%
5
V
T
G
40
6
&
B
7
H
4+
8
N
144
9
90
J
K
M
?
الالالا
الشاشاك
O
(
P
+
C
=
"
2
100
prt sc !
}
delete
+ backspace
1
1
e
pause
1
home
num
lock
enter
end
7
home
↑shift
4
1
4
BAL
8
1
end
Expert Solution
This question has been solved!
Explore an expertly crafted, step-by-step solution for a thorough understanding of key concepts.

This is a popular solution!

Trending now
This is a popular solution!

Step by step
Solved in 2 steps with 2 images

Recommended textbooks for you
Algebra & Trigonometry with Analytic Geometry
Algebra
ISBN:
9781133382119
Author:
Swokowski
Publisher:
Cengage


Algebra and Trigonometry (MindTap Course List)
Algebra
ISBN:
9781305071742
Author:
James Stewart, Lothar Redlin, Saleem Watson
Publisher:
Cengage Learning
Algebra & Trigonometry with Analytic Geometry
Algebra
ISBN:
9781133382119
Author:
Swokowski
Publisher:
Cengage
Algebra and Trigonometry (MindTap Course List)
Algebra
ISBN:
9781305071742
Author:
James Stewart, Lothar Redlin, Saleem Watson
Publisher:
Cengage Learning

College Algebra
Algebra
ISBN:
9781305115545
Author:
James Stewart, Lothar Redlin, Saleem Watson
Publisher:
Cengage Learning

Glencoe Algebra 1, Student Edition, 9780079039897…
Algebra
ISBN:
9780079039897
Author:
Carter
Publisher:
McGraw Hill

College Algebra (MindTap Course List)
Algebra
ISBN:
9781305652231
Author:
R. David Gustafson, Jeff Hughes
Publisher:
Cengage Learning