2.17 Income at the coffee shop. The first histogram below shows the distribution of the yearly incomes of 40 patrons at a college coffee shop. Suppose two new people walk into the coffee shop: one making $225,000 and the other $250,000. The second histogram shows the new income distribution. Summary statistics are also provided. 12 - 4 (1) (2) 40 42 60,680 1st Qu. 63,620 65,240 65,090 3rd Qu. 66,160 69,890 Min. 60,680 63,710 $60k $62.5k $65k $67.5k $70k (1) Median 65,350 Mean 73,300 66,540 250,000 37,321 Мах. 4 SD 2,122 $60k $110k $160k $210k $260k (2) (a) Would the mean or the median best represent what we might think of as a typical income for the 42 patrons at this coffee shop? What does this say about the robustness of the two measures? (b) Would the standard deviation or the IQR best represent the amount of variability in the incomes of the 42 patrons at this coffee shop? What does this say about the robustness of the two measures?
2.17 Income at the coffee shop. The first histogram below shows the distribution of the yearly incomes of 40 patrons at a college coffee shop. Suppose two new people walk into the coffee shop: one making $225,000 and the other $250,000. The second histogram shows the new income distribution. Summary statistics are also provided. 12 - 4 (1) (2) 40 42 60,680 1st Qu. 63,620 65,240 65,090 3rd Qu. 66,160 69,890 Min. 60,680 63,710 $60k $62.5k $65k $67.5k $70k (1) Median 65,350 Mean 73,300 66,540 250,000 37,321 Мах. 4 SD 2,122 $60k $110k $160k $210k $260k (2) (a) Would the mean or the median best represent what we might think of as a typical income for the 42 patrons at this coffee shop? What does this say about the robustness of the two measures? (b) Would the standard deviation or the IQR best represent the amount of variability in the incomes of the 42 patrons at this coffee shop? What does this say about the robustness of the two measures?

Glencoe Algebra 1, Student Edition, 9780079039897, 0079039898, 2018
18th Edition
ISBN:9780079039897
Author:Carter
Publisher:Carter
Chapter4: Equations Of Linear Functions
Section4.5: Correlation And Causation
Problem 21PFA

Related questions

Question
100%
What is a & b to the following prompt
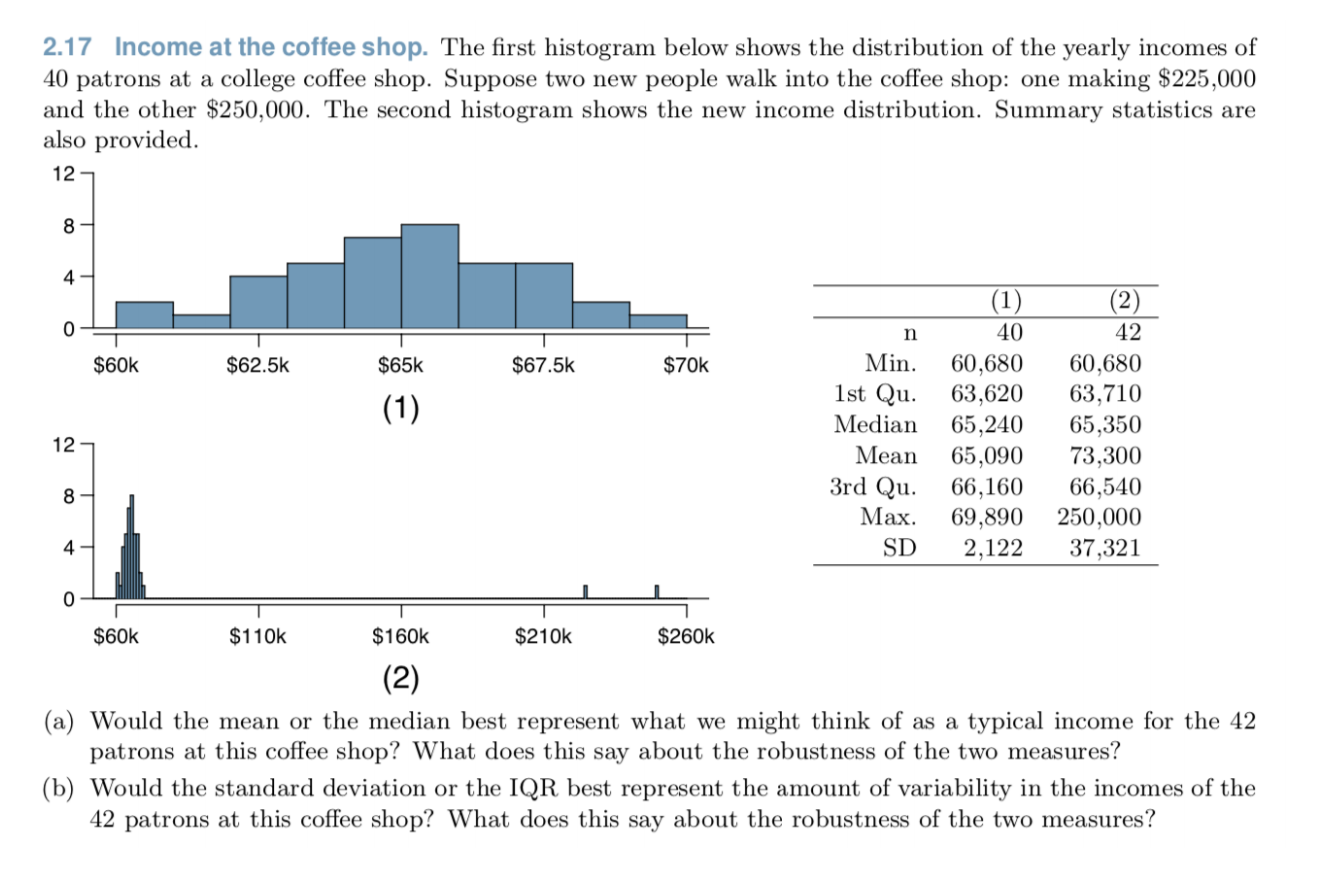
Transcribed Image Text:2.17 Income at the coffee shop. The first histogram below shows the distribution of the yearly incomes of
40 patrons at a college coffee shop. Suppose two new people walk into the coffee shop: one making $225,000
and the other $250,000. The second histogram shows the new income distribution. Summary statistics are
also provided.
12 -
4
(1)
(2)
40
42
60,680
1st Qu. 63,620
65,240
65,090
3rd Qu. 66,160
69,890
Min.
60,680
63,710
$60k
$62.5k
$65k
$67.5k
$70k
(1)
Median
65,350
Mean
73,300
66,540
250,000
37,321
Мах.
4
SD
2,122
$60k
$110k
$160k
$210k
$260k
(2)
(a) Would the mean or the median best represent what we might think of as a typical income for the 42
patrons at this coffee shop? What does this say about the robustness of the two measures?
(b) Would the standard deviation or the IQR best represent the amount of variability in the incomes of the
42 patrons at this coffee shop? What does this say about the robustness of the two measures?
Expert Solution
This question has been solved!
Explore an expertly crafted, step-by-step solution for a thorough understanding of key concepts.

This is a popular solution!

Trending now
This is a popular solution!

Step by step
Solved in 2 steps

Knowledge Booster


Learn more about
Need a deep-dive on the concept behind this application? Look no further. Learn more about this topic, statistics and related others by exploring similar questions and additional content below.Recommended textbooks for you
Glencoe Algebra 1, Student Edition, 9780079039897…
Algebra
ISBN:
9780079039897
Author:
Carter
Publisher:
McGraw Hill
Glencoe Algebra 1, Student Edition, 9780079039897…
Algebra
ISBN:
9780079039897
Author:
Carter
Publisher:
McGraw Hill