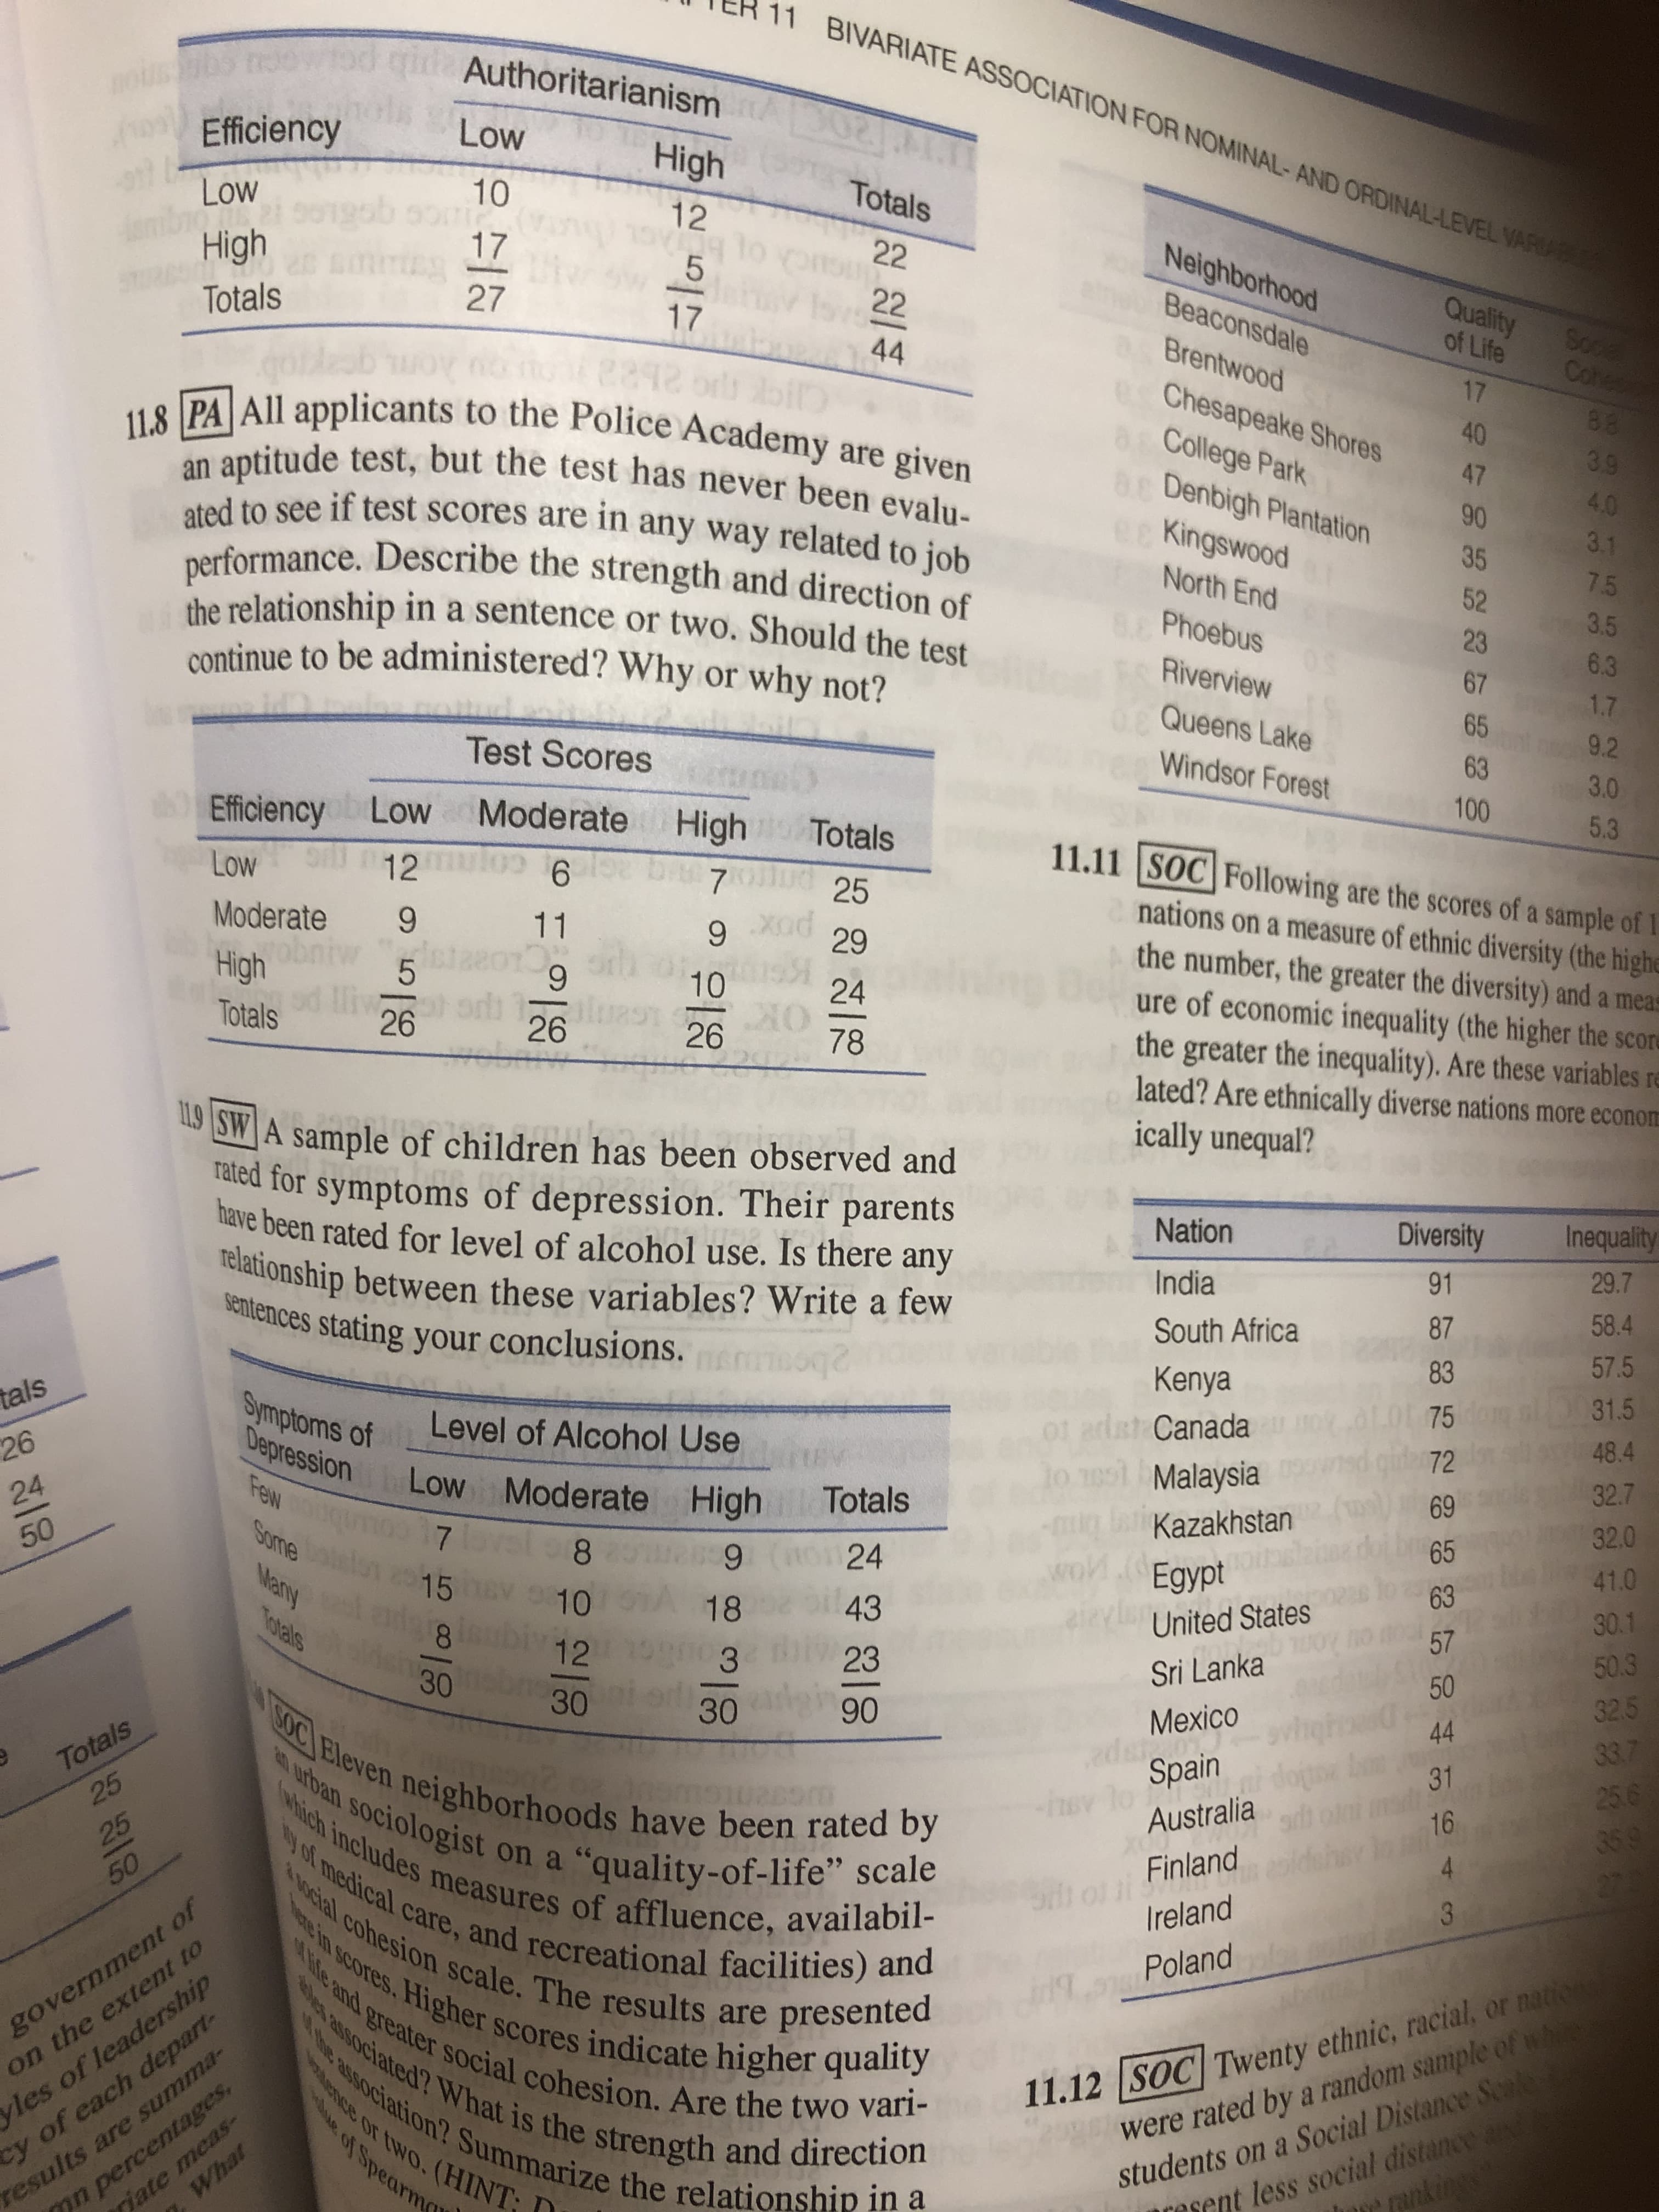
11 BIVARIATE ASSOCIATION FOR NOMINAL- AND ORDINAL-LEVEL VARIA i Authoritarianism Efficiency Low High Low 10 Totals 12 gto onsu 22 Neighborhood High 17 Quality of Life 22 Beaconsdale Totals 27 Soce Cohes 17 44 Brentwood २2१2 17 Chesapeake Shores 6 College Park 8E Denbigh Plantation ec Kingswood orlh 88 11.8 PA All applicants to the Police Academy are given 40 3.9 47 an aptitude test, but the test has never been evalu- ated to see if test scores are in any way related to job performance. Describe the strength and direction of the relationship in a sentence or two. Should the test continue to be administered? Why or why not? 4.0 90 3.1 35 North End 7.5 52 B Phoebus 3.5 23 6.3 Riverview 67 1.7 Queens Lake 65 9.2 Test Scores Windsor Forest 63 3.0 100 5.3 Moderate High 12 Tulo 6 52 b Efficiency b Low Totals 11.11 SOC Following are the scores of a sample of I Low 7 25 nations on a measure of ethnic diversity (the highe the number, the greater the diversity) and a meas ure of economic inequality (the higher the score the greater the inequality). Are these variables re lated? Are ethnically diverse nations more econom ically unequal? Moderate 11 29 High 10 24 Totals liv 26 26 26 78 119 SW A sample of children tated for symptoms of depression. Their parents have been rated for level of alcohol use. Is there any relationship between these variables? Write a few sentences stating your conclusions. has been observed and Nation Diversity Inequality India 91 29.7 87 58.4 South Africa 83 57.5 Kenya 31.5 75 01 adst Canada ol Malaysia tals Symptoms of Depression Level of Alcohol Use 72 48.4 26 32.7 Low Moderate High Totals 69 Few 24 Kazakhstan 32.0 Some 65 50 7. 24 Egypt 41.0 Many 63 15 30.1 50.3 32.5 33.7 25.6 359 27 10 18 43 United States Totals 57 12 23 Sri Lanka 50 30 ni o 30 90 Mexico ds Spain 30 3OC) Eleven neighborhoods have been rated by 44 Totals 25 EN urban sociologist on a "quality-of-life" scale which includes measures of affluence, availabil- ty of medical care, and recreational facilities) and ocial cohesion scale. The results are presented re in scores. Higher scores indicate higher quality 31 Australia 16 25 Finland "quality-of-life" scale 50 Ireland government of on the extent to Nfe and Poland vles of leadership cy of each depart- results are summa- mn percentages, riate meas- What les associated?What is the strength and direction the association? Summarize the relationship in a greater social cohesion. Are the two vari- dence or twwo. (HINT; 11.12 |SOC| Twenty ethnic, racial, or nations were rated by a random sample of whie students on a Social Distance Sca resent less social distance a pankings e of Spearm 4.

Glencoe Algebra 1, Student Edition, 9780079039897, 0079039898, 2018
18th Edition
ISBN:9780079039897
Author:Carter
Publisher:Carter
Chapter10: Statistics
Section: Chapter Questions
Problem 13PT
icon
Related questions
icon
Concept explainers
Topic Video
Question

Question 11.8 

11 BIVARIATE ASSOCIATION FOR NOMINAL- AND ORDINAL-LEVEL VARIA
i Authoritarianism
Efficiency
Low
High
Low
10
Totals
12
gto onsu
22
Neighborhood
High
17
Quality
of Life
22
Beaconsdale
Totals
27
Soce
Cohes
17
44
Brentwood
२2१2
17
Chesapeake Shores
6 College Park
8E Denbigh Plantation
ec Kingswood
orlh
88
11.8 PA All applicants to the Police Academy are given
40
3.9
47
an aptitude test, but the test has never been evalu-
ated to see if test scores are in any way related to job
performance. Describe the strength and direction of
the relationship in a sentence or two. Should the test
continue to be administered? Why or why not?
4.0
90
3.1
35
North End
7.5
52
B Phoebus
3.5
23
6.3
Riverview
67
1.7
Queens Lake
65
9.2
Test Scores
Windsor Forest
63
3.0
100
5.3
Moderate High
12 Tulo 6 52 b
Efficiency b Low
Totals
11.11 SOC Following are the scores of a sample of I
Low
7
25
nations on a measure of ethnic diversity (the highe
the number, the greater the diversity) and a meas
ure of economic inequality (the higher the score
the greater the inequality). Are these variables re
lated? Are ethnically diverse nations more econom
ically unequal?
Moderate
11
29
High
10
24
Totals
liv
26
26
26
78
119 SW A sample of children
tated for symptoms of depression. Their parents
have been rated for level of alcohol use. Is there any
relationship between these variables? Write a few
sentences stating your conclusions.
has been observed and
Nation
Diversity
Inequality
India
91
29.7
87
58.4
South Africa
83
57.5
Kenya
31.5
75
01 adst Canada
ol Malaysia
tals
Symptoms of
Depression
Level of Alcohol Use
72
48.4
26
32.7
Low Moderate
High Totals
69
Few
24
Kazakhstan
32.0
Some
65
50
7.
24
Egypt
41.0
Many
63
15
30.1
50.3
32.5
33.7
25.6
359
27
10
18
43
United States
Totals
57
12
23
Sri Lanka
50
30
ni o 30
90
Mexico
ds
Spain
30
3OC) Eleven neighborhoods have been rated by
44
Totals
25
EN urban sociologist on a "quality-of-life" scale
which includes measures of affluence, availabil-
ty of medical care, and recreational facilities) and
ocial cohesion scale. The results are presented
re in scores. Higher scores indicate higher quality
31
Australia
16
25
Finland
"quality-of-life" scale
50
Ireland
government of
on the extent to
Nfe and
Poland
vles of leadership
cy of each depart-
results are summa-
mn percentages,
riate meas-
What
les associated?What is the strength and direction
the association? Summarize the relationship in a
greater social cohesion. Are the two vari-
dence or twwo. (HINT;
11.12 |SOC| Twenty ethnic, racial, or nations
were rated by a random sample of whie
students on a Social Distance Sca
resent less social distance a
pankings
e of Spearm
4.
Transcribed Image Text:11 BIVARIATE ASSOCIATION FOR NOMINAL- AND ORDINAL-LEVEL VARIA i Authoritarianism Efficiency Low High Low 10 Totals 12 gto onsu 22 Neighborhood High 17 Quality of Life 22 Beaconsdale Totals 27 Soce Cohes 17 44 Brentwood २2१2 17 Chesapeake Shores 6 College Park 8E Denbigh Plantation ec Kingswood orlh 88 11.8 PA All applicants to the Police Academy are given 40 3.9 47 an aptitude test, but the test has never been evalu- ated to see if test scores are in any way related to job performance. Describe the strength and direction of the relationship in a sentence or two. Should the test continue to be administered? Why or why not? 4.0 90 3.1 35 North End 7.5 52 B Phoebus 3.5 23 6.3 Riverview 67 1.7 Queens Lake 65 9.2 Test Scores Windsor Forest 63 3.0 100 5.3 Moderate High 12 Tulo 6 52 b Efficiency b Low Totals 11.11 SOC Following are the scores of a sample of I Low 7 25 nations on a measure of ethnic diversity (the highe the number, the greater the diversity) and a meas ure of economic inequality (the higher the score the greater the inequality). Are these variables re lated? Are ethnically diverse nations more econom ically unequal? Moderate 11 29 High 10 24 Totals liv 26 26 26 78 119 SW A sample of children tated for symptoms of depression. Their parents have been rated for level of alcohol use. Is there any relationship between these variables? Write a few sentences stating your conclusions. has been observed and Nation Diversity Inequality India 91 29.7 87 58.4 South Africa 83 57.5 Kenya 31.5 75 01 adst Canada ol Malaysia tals Symptoms of Depression Level of Alcohol Use 72 48.4 26 32.7 Low Moderate High Totals 69 Few 24 Kazakhstan 32.0 Some 65 50 7. 24 Egypt 41.0 Many 63 15 30.1 50.3 32.5 33.7 25.6 359 27 10 18 43 United States Totals 57 12 23 Sri Lanka 50 30 ni o 30 90 Mexico ds Spain 30 3OC) Eleven neighborhoods have been rated by 44 Totals 25 EN urban sociologist on a "quality-of-life" scale which includes measures of affluence, availabil- ty of medical care, and recreational facilities) and ocial cohesion scale. The results are presented re in scores. Higher scores indicate higher quality 31 Australia 16 25 Finland "quality-of-life" scale 50 Ireland government of on the extent to Nfe and Poland vles of leadership cy of each depart- results are summa- mn percentages, riate meas- What les associated?What is the strength and direction the association? Summarize the relationship in a greater social cohesion. Are the two vari- dence or twwo. (HINT; 11.12 |SOC| Twenty ethnic, racial, or nations were rated by a random sample of whie students on a Social Distance Sca resent less social distance a pankings e of Spearm 4.
Expert Solution
trending now

Trending now

This is a popular solution!

steps

Step by step

Solved in 4 steps with 3 images

Blurred answer
Knowledge Booster
Sample space, Events, and Basic Rules of Probability
Learn more about
Need a deep-dive on the concept behind this application? Look no further. Learn more about this topic, statistics and related others by exploring similar questions and additional content below.
Recommended textbooks for you
Glencoe Algebra 1, Student Edition, 9780079039897…
Algebra
ISBN:
9780079039897
Author:
Carter
Publisher:
McGraw Hill
College Algebra (MindTap Course List)
Algebra
ISBN:
9781305652231
Author:
R. David Gustafson, Jeff Hughes
Publisher:
Cengage Learning