2.2.5 Using the Fresh Weight Data. Table 1.7: Summary Statistic of the Test on Fresh Weight Treatment N Mean Median cont 68 1.1737 1.1600 601.0043 100439600 625 1945 1245 Toal Minima Maxima 65 67 60 9140 9200 43 60 7322 3300 28 60 3035 3000 14 300 8259 8700 14 1.67 1.74 1.33 1.16 1.74 Sud. Deviation 21742 20523 18288 16663 00032 34570 Curkoni 147 1961 443 -116 Total observations average is 0.8259. The spread of the from the average is 0.34570. More observations are less median. Figure 2.14 : Shows outliers and the shap
2.2.5 Using the Fresh Weight Data. Table 1.7: Summary Statistic of the Test on Fresh Weight Treatment N Mean Median cont 68 1.1737 1.1600 601.0043 100439600 625 1945 1245 Toal Minima Maxima 65 67 60 9140 9200 43 60 7322 3300 28 60 3035 3000 14 300 8259 8700 14 1.67 1.74 1.33 1.16 1.74 Sud. Deviation 21742 20523 18288 16663 00032 34570 Curkoni 147 1961 443 -116 Total observations average is 0.8259. The spread of the from the average is 0.34570. More observations are less median. Figure 2.14 : Shows outliers and the shap

Linear Algebra: A Modern Introduction
4th Edition
ISBN:9781285463247
Author:David Poole
Publisher:David Poole
Chapter4: Eigenvalues And Eigenvectors
Section4.6: Applications And The Perron-frobenius Theorem
Problem 22EQ

Related questions
Question
I want a general explanation that expresses all the pictures
Transcribed Image Text:2.2.5 Using the Fresh Weight Data
Table 3.7 | Summary Statistic of the Treatment on Fresh Weight
Minimu
m
945
124S
Total
Maxima
m
1.67
1.74
Treatment N Mean Medias
control
348
60 1.1737
60 10043
1.1600
9600
9200
7300
.65
67
43
60 9160
60 7322
28
1.16
60 3035 3000 .14
48
300 8259 | 8700|| 14 1.74
Std.
Deviation Kurtois
887
21742
20523
18285
1861
281
16663
443
07032
110-
34570 || -589- |
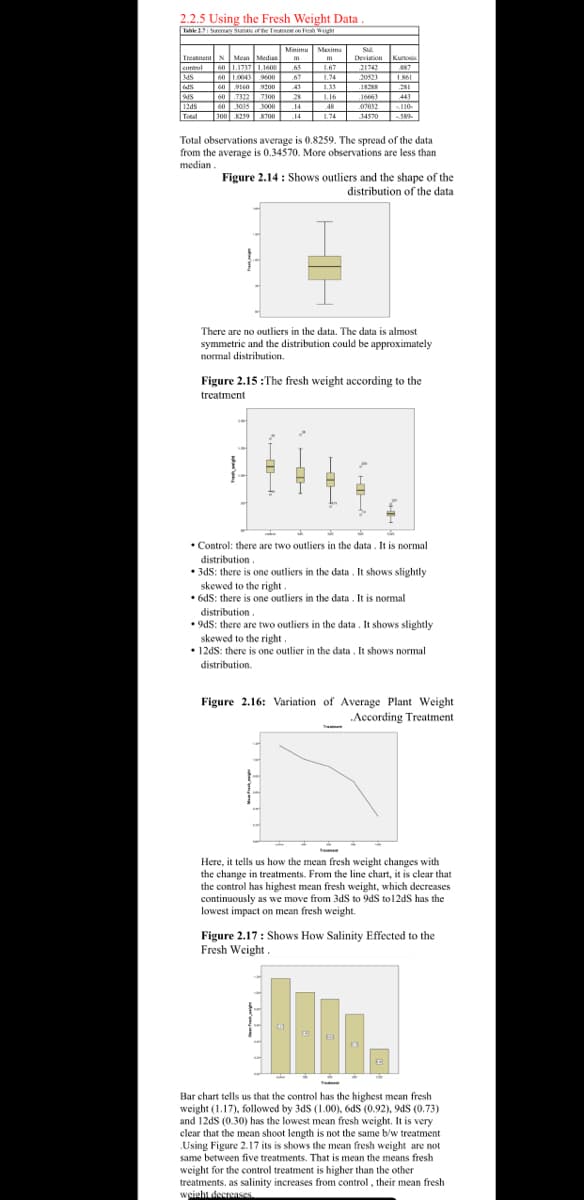
Total observations average is 0.8259. The spread of the data
from the average is 0.34570. More observations are less than
median.
Figure 2.14: Shows outliers and the shape of the
distribution of the data
There are no outliers in the data. The data is almost
symmetric and the distribution could be approximately
normal distribution.
Figure 2.15:The fresh weight according to the
treatment
• Control: there are two outliers in the data. It is normal
distribution.
• 3ds: there is one outliers in the data. It shows slightly
skewed to the right
• 6dS: there is one outliers in the data. It is normal
distribution.
9ds: there are two outliers in the data. It shows slightly
skewed to the right
• 12dS: there is one outlier in the data. It shows normal
distribution.
Figure 2.16: Variation of Average Plant Weight
According Treatment
Here, it tells us how the mean fresh weight changes with
the change in treatments. From the line chart, it is clear that
the control has highest mean fresh weight, which decreases
continuously as we move from 3dS to 9dS to 12dS has the
lowest impact on mean fresh weight.
Figure 2.17: Shows How Salinity Effected to the
Fresh Weight.
Bar chart tells us that the control has the highest mean fresh
weight (1.17), followed by 3dS (1.00), 6ds (0.92), 9dS (0.73)
and 12dS (0.30) has the lowest mean fresh weight. It is very
clear that the mean shoot length is not the same b/w treatment
Using Figure 2.17 its is shows the mean fresh weight are not
same between five treatments. That is mean the means fresh
weight for the control treatment is higher than the other
treatments, as salinity increases from control, their mean fresh
weight decreases.
Transcribed Image Text:treatment Height Mean fresh weight Lowest mean fresh weight
Control Cultivars 6
Cultivars 9
3dS
Cultivars 12
Cultivars 9
6dS
Cultivars 12
Cultivars 9
9dS
Cultivars 4
12dS
Cultivars 3
Mean Fresh_weight
1.50-
1.00-
0.50
0.00-
Cultivars
WQ226
Black
Missani
Sannine
Cooly
Humira
control
305
White Missa
MA
WQ101
WQ107
Total
Cultivars 1
Cultivars 1
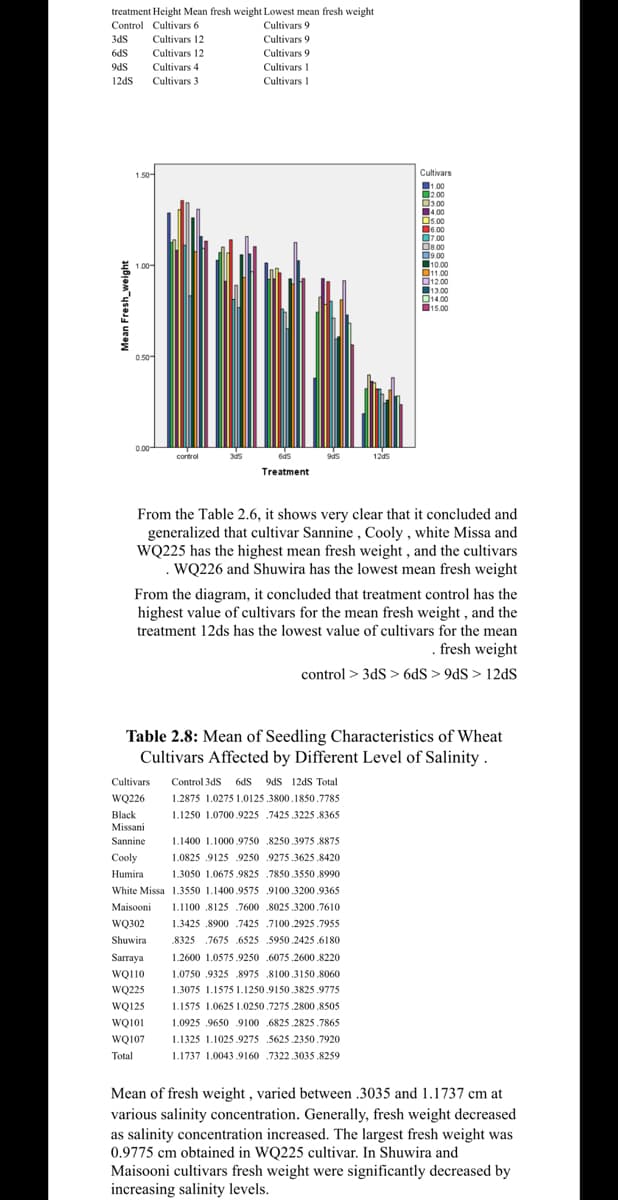
From the Table 2.6, it shows very clear that it concluded and
generalized that cultivar Sannine, Cooly, white Missa and
WQ225 has the highest mean fresh weight, and the cultivars
WQ226 and Shuwira has the lowest mean fresh weight
From the diagram, it concluded that treatment control has the
highest value of cultivars for the mean fresh weight, and the
treatment 12ds has the lowest value of cultivars for the mean
. fresh weight
control > 3ds > 6dS > 9dS> 12dS
1.3050 1.0675.9825
1.3550 1.1400.9575
1
600
Maisooni 1.1100 .8125 7600
w
WQ302
Love
Shuwira
Snww.na
wwwwwww ...
1.3425 8900 7425
Sarraya
WQ110
WQ225
WQ125
6ds
Treatment
Table 2.8: Mean of Seedling Characteristics of Wheat
Cultivars Affected by Different Level of Salinity.
1.1400 1.1000.9750
1.0825 9125 9250
9ds
Control 3ds 6ds 9dS 12dS Total
1.2875 1.0275 1.0125.3800.1850.7785
1.1250 1.0700.9225 7425.3225.8365
8250.3975.8875
9275.3625.8420
7850.3550.8990
9100.3200.9365
0026 3300 7610
8025.3200.7610
7100.2925.7955
8325 7675 6525 5950.2425.6180
1.2600 1.0575.9250 6075.2600.8220
1:2000 1:001332000132000.0220
1.0750 9325 8975 8100.3150.8060
1:0730 9323
www
1.3075 1.1575 1.1250.9150.3825.9775
12d5
POSS
Cultivars
1.00
2.00
3.00
4.00
1.1575 1.0625 1.0250.7275.2800.8505
1.0925 9650 9100 .6825.2825.7865
1.1325 1.1025.9275 5625.2350.7920
1.1737 1.0043.9160 .7322.3035.8259
5.00
6.00
7.00
8.00
9.00
10.00
11.00
12.00
13.00
14.00
15.00
Mean of fresh weight, varied between .3035 and 1.1737 cm at
various salinity concentration. Generally, fresh weight decreased
as salinity concentration increased. The largest fresh weight was
0.9775 cm obtained in WQ225 cultivar. In Shuwira and
Maisooni cultivars fresh weight were significantly decreased by
increasing salinity levels.
Expert Solution
This question has been solved!
Explore an expertly crafted, step-by-step solution for a thorough understanding of key concepts.

Step by step
Solved in 3 steps

Recommended textbooks for you
Linear Algebra: A Modern Introduction
Algebra
ISBN:
9781285463247
Author:
David Poole
Publisher:
Cengage Learning
Linear Algebra: A Modern Introduction
Algebra
ISBN:
9781285463247
Author:
David Poole
Publisher:
Cengage Learning