The included table presents the percentage of each state’s residents who were living in poverty in 2002. The data includes a data value for the District of Columbia so there are 51 data values. Create a Frequency distribution and Cummultaive distribution of these data using EXCEL/ SPREADSHEET. Generate the following: Barchart of the Frequency Distribution Ogive of the Cummulative Distribution
The included table presents the percentage of each state’s residents who were living in poverty in 2002. The data includes a data value for the District of Columbia so there are 51 data values. Create a Frequency distribution and Cummultaive distribution of these data using EXCEL/ SPREADSHEET. Generate the following: Barchart of the Frequency Distribution Ogive of the Cummulative Distribution

Glencoe Algebra 1, Student Edition, 9780079039897, 0079039898, 2018
18th Edition
ISBN:9780079039897
Author:Carter
Publisher:Carter
Chapter10: Statistics
Section: Chapter Questions
Problem 8SGR

Related questions
Question
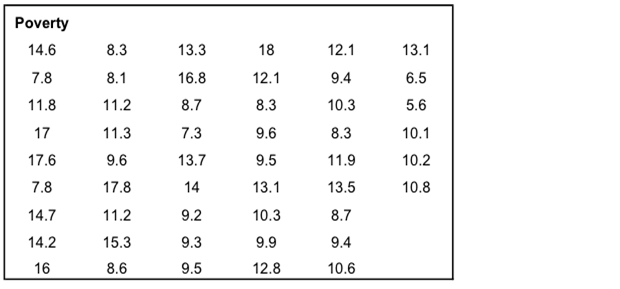
The included table presents the percentage of each state’s residents who were living in poverty in 2002. The data includes a data value for the District of Columbia so there are 51 data values.
Create a Frequency distribution and Cummultaive distribution of these data using EXCEL/ SPREADSHEET.
Generate the following:
- Barchart of the Frequency Distribution
- Ogive of the Cummulative Distribution
Transcribed Image Text:Poverty
14.6
7.8
11.8
17
17.6
7.8
14.7
14.2
16
8.3
8.1
11.2
11.3
9.6
17.8
11.2
15.3
8.6
13.3
16.8
8.7
7.3
13.7
14
9.2
9.3
9.5
18
12.1
8.3
9.6
9.5
13.1
10.3
9.9
12.8
12.1
9.4
10.3
8.3
11.9
13.5
8.7
9.4
10.6
13.1
6.5
5.6
10.1
10.2
10.8
Expert Solution
This question has been solved!
Explore an expertly crafted, step-by-step solution for a thorough understanding of key concepts.

This is a popular solution!

Trending now
This is a popular solution!

Step by step
Solved in 3 steps with 4 images

Recommended textbooks for you
Glencoe Algebra 1, Student Edition, 9780079039897…
Algebra
ISBN:
9780079039897
Author:
Carter
Publisher:
McGraw Hill
Glencoe Algebra 1, Student Edition, 9780079039897…
Algebra
ISBN:
9780079039897
Author:
Carter
Publisher:
McGraw Hill