2.20 Assortative mating: Assortative mating is a nonrandom mating pattern where individuals with similar genotypes and/or phenotypes mate with one another more frequently than what would be expected under a random mating pattern. Researchers studying this topic collected data on eye colors of 212 Scandinavian men and their female partners. The table below summarizes the results (rows represent male eye color while columns represent female eye color). For simplicity, we only include heterosexual relationships in this exercise. (please round any numerical answers to 4 decimal places) Blue Brown Green Total Blue 49 20 22 91 Brown 17 22 14 53 Green 22 17 29 68 Total 88 59 65 212 a) What is the probability that a randomly chosen male respondent or his partner has blue eyes? b) What is the probability that a randomly chosen male respondent with blue eyes has a partner with blue eyes? c) What is the probability that a randomly chosen male respondent with brown eyes has a partner with blue
2.20 Assortative mating: Assortative mating is a nonrandom mating pattern where individuals with similar genotypes and/or phenotypes mate with one another more frequently than what would be expected under a random mating pattern. Researchers studying this topic collected data on eye colors of 212 Scandinavian men and their female partners. The table below summarizes the results (rows represent male eye color while columns represent female eye color). For simplicity, we only include heterosexual relationships in this exercise. (please round any numerical answers to 4 decimal places) Blue Brown Green Total Blue 49 20 22 91 Brown 17 22 14 53 Green 22 17 29 68 Total 88 59 65 212 a) What is the probability that a randomly chosen male respondent or his partner has blue eyes? b) What is the probability that a randomly chosen male respondent with blue eyes has a partner with blue eyes? c) What is the probability that a randomly chosen male respondent with brown eyes has a partner with blue

Glencoe Algebra 1, Student Edition, 9780079039897, 0079039898, 2018
18th Edition
ISBN:9780079039897
Author:Carter
Publisher:Carter
Chapter10: Statistics
Section: Chapter Questions
Problem 13PT

Related questions
Question
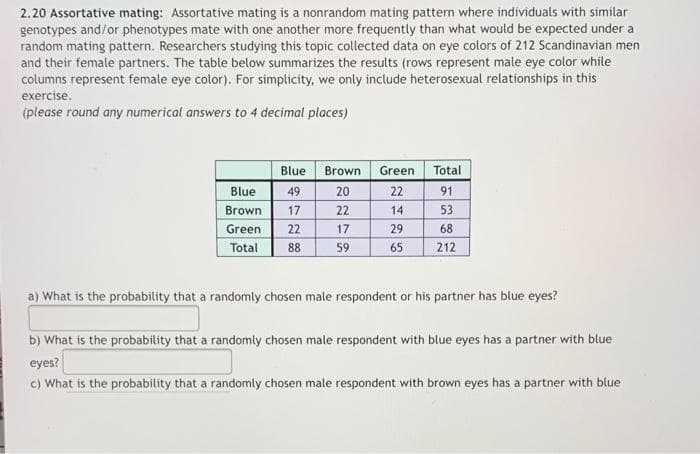
Transcribed Image Text:2.20 Assortative mating: Assortative mating is a nonrandom mating pattern where individuals with similar
genotypes and/or phenotypes mate with one another more frequently than what would be expected under a
random mating pattern. Researchers studying this topic collected data on eye colors of 212 Scandinavian men
and their female partners. The table below summarizes the results (rows represent male eye color while
columns represent female eye color). For simplicity, we only include heterosexual relationships in this
exercise.
(please round any numerical answers to 4 decimal places)
Blue
Brown
Green
Total
Blue
49
20
22
91
Brown
17
22
14
53
Green
22
17
29
68
Total
88
59
65
212
a) What is the probability that a randomly chosen male respondent or his partner has blue eyes?
b) What is the probability that a randomly chosen male respondent with blue eyes has a partner with blue
eyes?
c) What is the probability that a randomly chosen male respondent with brown eyes has a partner with blue
Expert Solution
This question has been solved!
Explore an expertly crafted, step-by-step solution for a thorough understanding of key concepts.

This is a popular solution!

Trending now
This is a popular solution!

Step by step
Solved in 3 steps with 3 images

Recommended textbooks for you
Glencoe Algebra 1, Student Edition, 9780079039897…
Algebra
ISBN:
9780079039897
Author:
Carter
Publisher:
McGraw Hill

Holt Mcdougal Larson Pre-algebra: Student Edition…
Algebra
ISBN:
9780547587776
Author:
HOLT MCDOUGAL
Publisher:
HOLT MCDOUGAL
Glencoe Algebra 1, Student Edition, 9780079039897…
Algebra
ISBN:
9780079039897
Author:
Carter
Publisher:
McGraw Hill
Holt Mcdougal Larson Pre-algebra: Student Edition…
Algebra
ISBN:
9780547587776
Author:
HOLT MCDOUGAL
Publisher:
HOLT MCDOUGAL