A study of the ability of individuals to walk in a straight line reported the accompanying data on cadence (strides per second) for a sample of n = 20 randomly selected healthy men. 0.94 0.85 0.92 0.95 0.93 0.87 1.00 0.92 0.85 0.81 0.75 0.93 0.93 1.04 0.93 1.06 1.06 0.96 0.81 0.98 A normal probability plot gives substantial support to the assumption that the population distribution of cadence is approximately normal. A descriptive summary of the data from Minitab 三 follows. Variable N Mean Median TrMean StDev SEMean cadence 20 0.9245 0.9300 0.9267 0.0833 0.0186 Variable Min Маx Q1 Q3 cadence 0.7500 1.0600 0.8600 0.9700 (a) Calculate and interpret a 95% confidence interval for population mean cadence. (Round your answers to two decimal places.) strides per second Interpret this interval. O with 95% confidence, the value of the true mean cadence of all such men falls above the confidence interval. O with 95% confidence, the value of the true mean cadence of all such men falls inside the confidence interval. O with 95% confidence, the value of the true mean cadence of all such men falls below the confidence interval. (b) Calculate and interpret a 95% prediction interval for the cadence of a single individual randomly selected from this population. (Round your answers to two decimal places.) strides per second
A study of the ability of individuals to walk in a straight line reported the accompanying data on cadence (strides per second) for a sample of n = 20 randomly selected healthy men. 0.94 0.85 0.92 0.95 0.93 0.87 1.00 0.92 0.85 0.81 0.75 0.93 0.93 1.04 0.93 1.06 1.06 0.96 0.81 0.98 A normal probability plot gives substantial support to the assumption that the population distribution of cadence is approximately normal. A descriptive summary of the data from Minitab 三 follows. Variable N Mean Median TrMean StDev SEMean cadence 20 0.9245 0.9300 0.9267 0.0833 0.0186 Variable Min Маx Q1 Q3 cadence 0.7500 1.0600 0.8600 0.9700 (a) Calculate and interpret a 95% confidence interval for population mean cadence. (Round your answers to two decimal places.) strides per second Interpret this interval. O with 95% confidence, the value of the true mean cadence of all such men falls above the confidence interval. O with 95% confidence, the value of the true mean cadence of all such men falls inside the confidence interval. O with 95% confidence, the value of the true mean cadence of all such men falls below the confidence interval. (b) Calculate and interpret a 95% prediction interval for the cadence of a single individual randomly selected from this population. (Round your answers to two decimal places.) strides per second

Holt Mcdougal Larson Pre-algebra: Student Edition 2012
1st Edition
ISBN:9780547587776
Author:HOLT MCDOUGAL
Publisher:HOLT MCDOUGAL
Chapter11: Data Analysis And Probability
Section: Chapter Questions
Problem 8CR

Related questions
Question
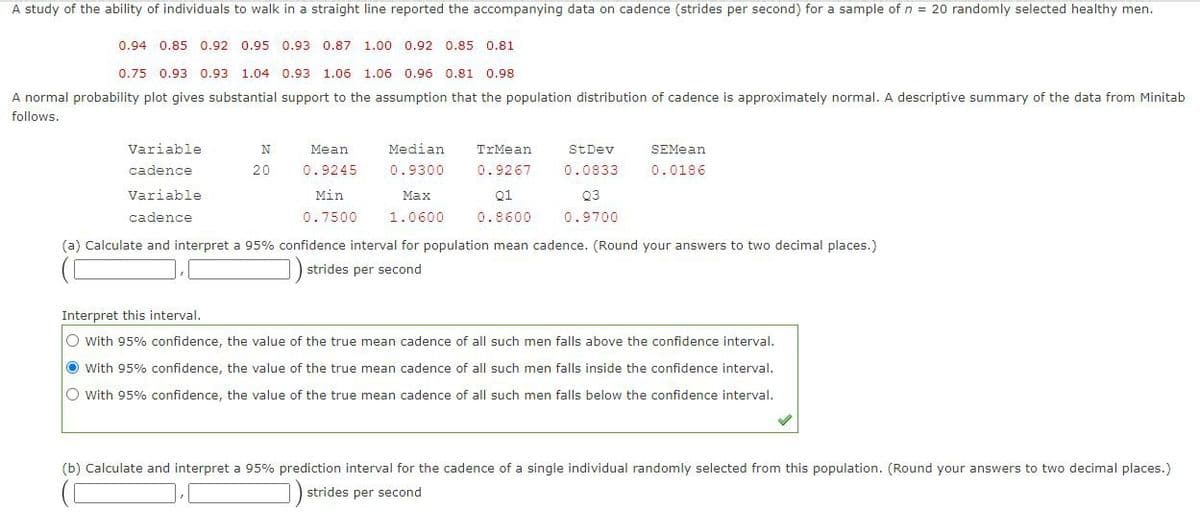
Transcribed Image Text:A study of the ability of individuals to walk in a straight line reported the accompanying data on cadence (strides per second) for a sample of n = 20 randomly selected healthy men.
0.94 0.85 0.92 0.95 0.93 0.87 1.00 0.92 0.85 0.81
0.75 0.93 0.93 1.04 0.93 1.06 1.06 0.96 0.81 0.98
A normal probability plot gives substantial support to the assumption that the population distribution of cadence is approximately normal. A descriptive summary of the data from Minitab
follows.
Variable
N
Mean
Median
TrMean
StDev
SEMean
cadence
20
0.9245
0.9300
0.9267
0.0833
0.0186
Variable
Min
Маx
Q1
Q3
cadence
0.7500
1.0600
0.8600
0.9700
(a) Calculate and interpret a 95% confidence interval for population mean cadence. (Round your answers to two decimal places.)
strides per second
Interpret this interval.
O with 95% confidence, the value of the true mean cadence of all such men falls above the confidence interval.
O with 95% confidence, the value of the true mean cadence of all such men falls inside the confidence interval.
O with 95% confidence, the value of the true mean cadence of all such men falls below the confidence interval.
(b) Calculate and interpret a 95% prediction interval for the cadence of a single individual randomly selected from this population. (Round your answers to two decimal places.)
) strides per second
Expert Solution
This question has been solved!
Explore an expertly crafted, step-by-step solution for a thorough understanding of key concepts.

This is a popular solution!

Trending now
This is a popular solution!

Step by step
Solved in 2 steps with 1 images

Recommended textbooks for you
Holt Mcdougal Larson Pre-algebra: Student Edition…
Algebra
ISBN:
9780547587776
Author:
HOLT MCDOUGAL
Publisher:
HOLT MCDOUGAL

Glencoe Algebra 1, Student Edition, 9780079039897…
Algebra
ISBN:
9780079039897
Author:
Carter
Publisher:
McGraw Hill
Holt Mcdougal Larson Pre-algebra: Student Edition…
Algebra
ISBN:
9780547587776
Author:
HOLT MCDOUGAL
Publisher:
HOLT MCDOUGAL
Glencoe Algebra 1, Student Edition, 9780079039897…
Algebra
ISBN:
9780079039897
Author:
Carter
Publisher:
McGraw Hill