A study of the ability of individuals to walk in a straight line reported the accompanying data on cadence (strides per second) for a sample of n = 20 randomly selected healthy men. 0.93 0.85 0.92 0.95 0.93 0.85 1.00 0.92 0.85 0.81 0.77 0.93 0.93 1.04 0.93 1.06 1.07 0.96 0.81 0.95 A normal probability plot gives substantial support to the assumption that the population distribution of cadence is approximately normal. A descriptive summary of the data from Minitab follows. Variable Mean Median TrMean StDev SEMean cadence 20 0.9230 0.9300 0.9233 0.0821 0.0184 Variable Min Маx Q1 Q3 cadence 0.7700 1.0700 0.8500 0.9550 (a) Calculate and interpret a 95% confidence interval for population mean cadence. (Round your answers to two decimal places.) 1) strides per second Interpret this interval. O with 95% confidence, the value of the true mean cadence of all such men falls inside the confidence interval. O with 95% confidence, the value of the true mean cadence of all such men falls below the confidence interval. O with 95% confidence, the value of the true mean cadence of all such men falls above the confidence interval. (b) Calculate and interpret a 95% prediction interval for the cadence of a single individual randomly selected from this population. (Round your answers to two decimal places.) strides per second
A study of the ability of individuals to walk in a straight line reported the accompanying data on cadence (strides per second) for a sample of n = 20 randomly selected healthy men. 0.93 0.85 0.92 0.95 0.93 0.85 1.00 0.92 0.85 0.81 0.77 0.93 0.93 1.04 0.93 1.06 1.07 0.96 0.81 0.95 A normal probability plot gives substantial support to the assumption that the population distribution of cadence is approximately normal. A descriptive summary of the data from Minitab follows. Variable Mean Median TrMean StDev SEMean cadence 20 0.9230 0.9300 0.9233 0.0821 0.0184 Variable Min Маx Q1 Q3 cadence 0.7700 1.0700 0.8500 0.9550 (a) Calculate and interpret a 95% confidence interval for population mean cadence. (Round your answers to two decimal places.) 1) strides per second Interpret this interval. O with 95% confidence, the value of the true mean cadence of all such men falls inside the confidence interval. O with 95% confidence, the value of the true mean cadence of all such men falls below the confidence interval. O with 95% confidence, the value of the true mean cadence of all such men falls above the confidence interval. (b) Calculate and interpret a 95% prediction interval for the cadence of a single individual randomly selected from this population. (Round your answers to two decimal places.) strides per second

MATLAB: An Introduction with Applications
6th Edition
ISBN:9781119256830
Author:Amos Gilat
Publisher:Amos Gilat
Chapter1: Starting With Matlab
Section: Chapter Questions
Problem 1P

Related questions
Question
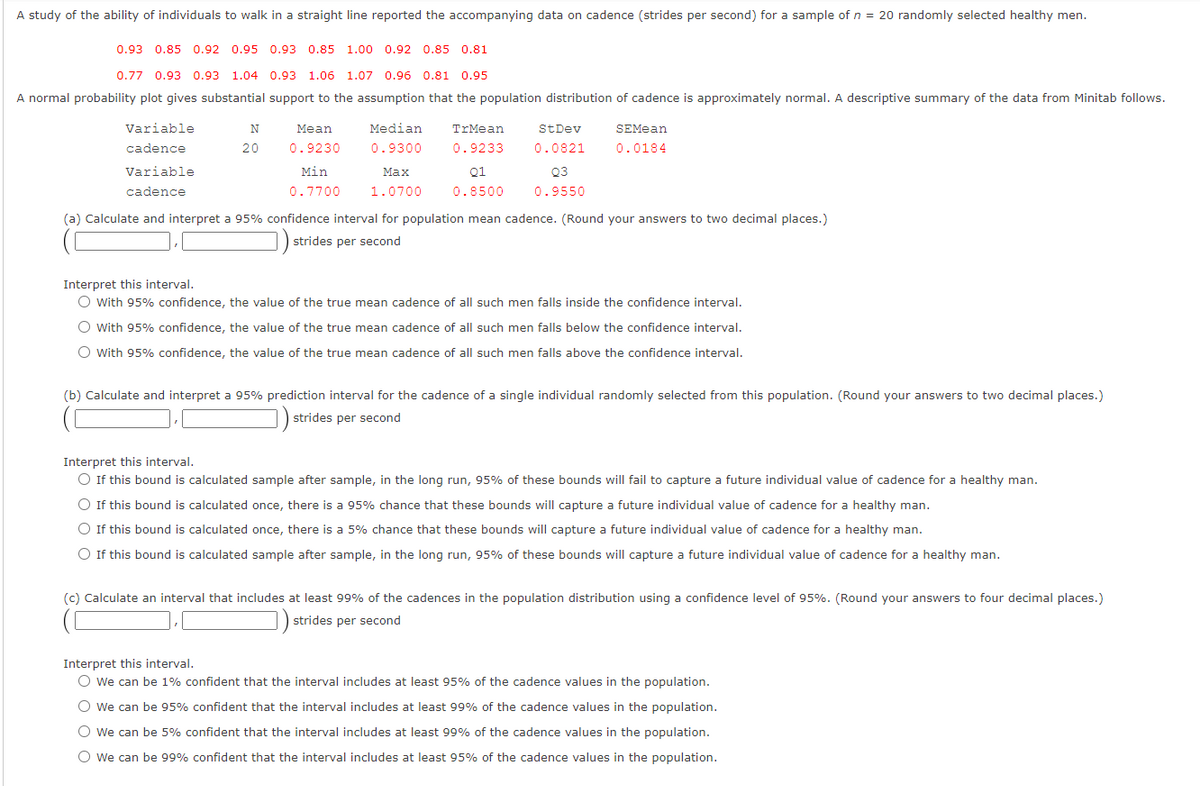
Transcribed Image Text:A study of the ability of individuals to walk in a straight line reported the accompanying data on cadence (strides per second) for a sample of n = 20 randomly selected healthy men.
0.93 0.85 0.92 0.95 0.93 0.85 1.00 0.92 0.85 0.81
0.77
0.93 0.93 1.04 0.93 1.06 1.07 0.96 0.81 0.95
A normal probability plot gives substantial support to the assumption that the population distribution of cadence is approximately normal. A descriptive summary of the data from Minitab follows.
Variable
N
Mean
Median
TrMean
StDev
SEMean
cadence
20
0.9230
0.9300
0.9233
0.0821
0.0184
Variable
Min
Маx
Q1
Q3
cadence
0.7700
1.0700
0.8500
0.9550
(a) Calculate and interpret a 95% confidence interval for population mean cadence. (Round your answers to two decimal places.)
) strides per second
Interpret this interval.
O with 95% confidence, the value of the true mean cadence of all such men falls inside the confidence interval.
O with 95% confidence, the value of the true mean cadence of all such men falls below the confidence interval.
O with 95% confidence, the value of the true mean cadence of all such men falls above the confidence interval.
(b) Calculate and interpret a 95% prediction interval for the cadence of a single individual randomly selected from this population. (Round your answers to two decimal places.)
strides per second
Interpret this interval.
O If this bound is calculated sample after sample, in the long run, 95% of these bounds will fail to capture a future individual value of cadence for a healthy man.
O If this bound is calculated once, there is a 95% chance that these bounds will capture a future individual value of cadence for a healthy man.
O If this bound is calculated once, there is a 5% chance that these bounds will capture a future individual value of cadence for a healthy man.
O If this bound is calculated sample after sample, in the long run, 95% of these bounds will capture a future individual value of cadence for a healthy man.
(c) Calculate an interval that includes at least 99% of the cadences in the population distribution using a confidence level of 95%. (Round your answers to four decimal places.)
strides per second
Interpret this interval.
O we can be 1% confident that the interval includes at least 95% of the cadence values in the population.
O we can be 95% confident that the interval includes at least 99% of the cadence values in the population.
O we can be 5% confident that the interval includes at least 99% of the cadence values in the population.
O we can be 99% confident that the interval includes at least 95% of the cadence values in the population.
Expert Solution
This question has been solved!
Explore an expertly crafted, step-by-step solution for a thorough understanding of key concepts.

This is a popular solution!

Trending now
This is a popular solution!

Step by step
Solved in 4 steps with 3 images

Recommended textbooks for you
MATLAB: An Introduction with Applications
Statistics
ISBN:
9781119256830
Author:
Amos Gilat
Publisher:
John Wiley & Sons Inc

Probability and Statistics for Engineering and th…
Statistics
ISBN:
9781305251809
Author:
Jay L. Devore
Publisher:
Cengage Learning

Statistics for The Behavioral Sciences (MindTap C…
Statistics
ISBN:
9781305504912
Author:
Frederick J Gravetter, Larry B. Wallnau
Publisher:
Cengage Learning
MATLAB: An Introduction with Applications
Statistics
ISBN:
9781119256830
Author:
Amos Gilat
Publisher:
John Wiley & Sons Inc
Probability and Statistics for Engineering and th…
Statistics
ISBN:
9781305251809
Author:
Jay L. Devore
Publisher:
Cengage Learning
Statistics for The Behavioral Sciences (MindTap C…
Statistics
ISBN:
9781305504912
Author:
Frederick J Gravetter, Larry B. Wallnau
Publisher:
Cengage Learning

Elementary Statistics: Picturing the World (7th E…
Statistics
ISBN:
9780134683416
Author:
Ron Larson, Betsy Farber
Publisher:
PEARSON

The Basic Practice of Statistics
Statistics
ISBN:
9781319042578
Author:
David S. Moore, William I. Notz, Michael A. Fligner
Publisher:
W. H. Freeman

Introduction to the Practice of Statistics
Statistics
ISBN:
9781319013387
Author:
David S. Moore, George P. McCabe, Bruce A. Craig
Publisher:
W. H. Freeman