2.86 Shaft graves in ancient Greece. Refer to the American Journal of Archaeology (Jan. 2014) study of sword shaft SHAFTS graves in ancient Greece, Exercise 2.60 (p. 61). The num- ber of sword shafts buried at each of 13 recently discovered grave sites is reproduced in the following table. 1 2 3 1 5 6 2 4 1 2 4 2 9 Source: Harrell, K. "The fallen and their swords: A new explanation for the rise of the shaft graves." American Journal of Archaeology, Vol. 118, No. 1, January 2014 (Figure 1). a. Calculate the range of the sample data. b. Calculate the variance of the sample data. c. Calculate the standard deviation of the sample data.
2.86 Shaft graves in ancient Greece. Refer to the American Journal of Archaeology (Jan. 2014) study of sword shaft SHAFTS graves in ancient Greece, Exercise 2.60 (p. 61). The num- ber of sword shafts buried at each of 13 recently discovered grave sites is reproduced in the following table. 1 2 3 1 5 6 2 4 1 2 4 2 9 Source: Harrell, K. "The fallen and their swords: A new explanation for the rise of the shaft graves." American Journal of Archaeology, Vol. 118, No. 1, January 2014 (Figure 1). a. Calculate the range of the sample data. b. Calculate the variance of the sample data. c. Calculate the standard deviation of the sample data.

Holt Mcdougal Larson Pre-algebra: Student Edition 2012
1st Edition
ISBN:9780547587776
Author:HOLT MCDOUGAL
Publisher:HOLT MCDOUGAL
Chapter11: Data Analysis And Probability
Section: Chapter Questions
Problem 8CR

Related questions
Question
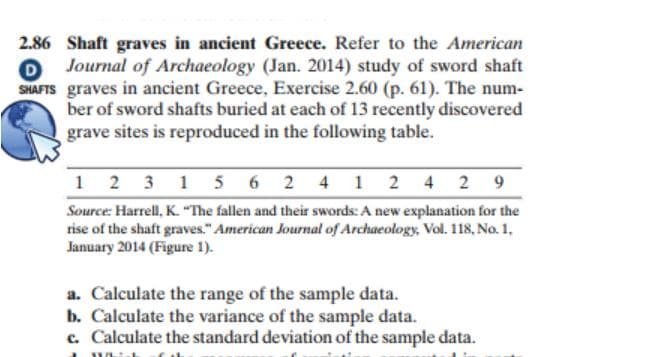
Transcribed Image Text:2.86 Shaft graves in ancient Greece. Refer to the American
O Journal of Archaeology (Jan. 2014) study of sword shaft
SHAFTS graves in ancient Greece, Exercise 2.60 (p. 61). The num-
ber of sword shafts buried at each of 13 recently discovered
grave sites is reproduced in the following table.
1 2 3 1 5 6 2 4 1 2 4 2 9
Source: Harrell, K. "The fallen and their swords: A new explanation for the
rise of the shaft graves." American Journal of Archaeology, Vol. 118, No. 1,
January 2014 (Figure 1).
a. Calculate the range of the sample data.
b. Calculate the variance of the sample data.
c. Calculate the standard deviation of the sample data.
Expert Solution
This question has been solved!
Explore an expertly crafted, step-by-step solution for a thorough understanding of key concepts.

This is a popular solution!

Trending now
This is a popular solution!

Step by step
Solved in 2 steps with 2 images

Recommended textbooks for you
Holt Mcdougal Larson Pre-algebra: Student Edition…
Algebra
ISBN:
9780547587776
Author:
HOLT MCDOUGAL
Publisher:
HOLT MCDOUGAL
Holt Mcdougal Larson Pre-algebra: Student Edition…
Algebra
ISBN:
9780547587776
Author:
HOLT MCDOUGAL
Publisher:
HOLT MCDOUGAL