20 representative students were selected from each of 5 schools intermediate level. The 100 selected students presented themselves to a Math Quiz. A researcher wants to prove that the averages Mathematics performance is not the same in the five schools. I know analyzed the data mediated by ANOVA. Sources / degrees of freedom / sum of squares / squares media / Fcalculated / pvalue Between groups - 2000 Within groups - 9500 Complete the table to answer: 1) The mean square between groups is: 2) The mean square within groups is: 3). The test calculation is:
20 representative students were selected from each of 5 schools intermediate level. The 100 selected students presented themselves to a Math Quiz. A researcher wants to prove that the averages Mathematics performance is not the same in the five schools. I know analyzed the data mediated by ANOVA. Sources / degrees of freedom / sum of squares / squares media / Fcalculated / pvalue Between groups - 2000 Within groups - 9500 Complete the table to answer: 1) The mean square between groups is: 2) The mean square within groups is: 3). The test calculation is:

MATLAB: An Introduction with Applications
6th Edition
ISBN:9781119256830
Author:Amos Gilat
Publisher:Amos Gilat
Chapter1: Starting With Matlab
Section: Chapter Questions
Problem 1P

Related questions
Question
20 representative students were selected from each of 5 schools intermediate level. The 100 selected students presented themselves to a Math Quiz. A researcher wants to prove that the averages Mathematics performance is not the same in the five schools. I know analyzed the data mediated by ANOVA.
Sources / degrees of freedom / sum of squares / squares media / Fcalculated / pvalue
Between groups - 2000
Within groups - 9500
Complete the table to answer:
1) The
2) The mean square within groups is:
3). The test calculation is:
4) The value is:
5. Conclusion:
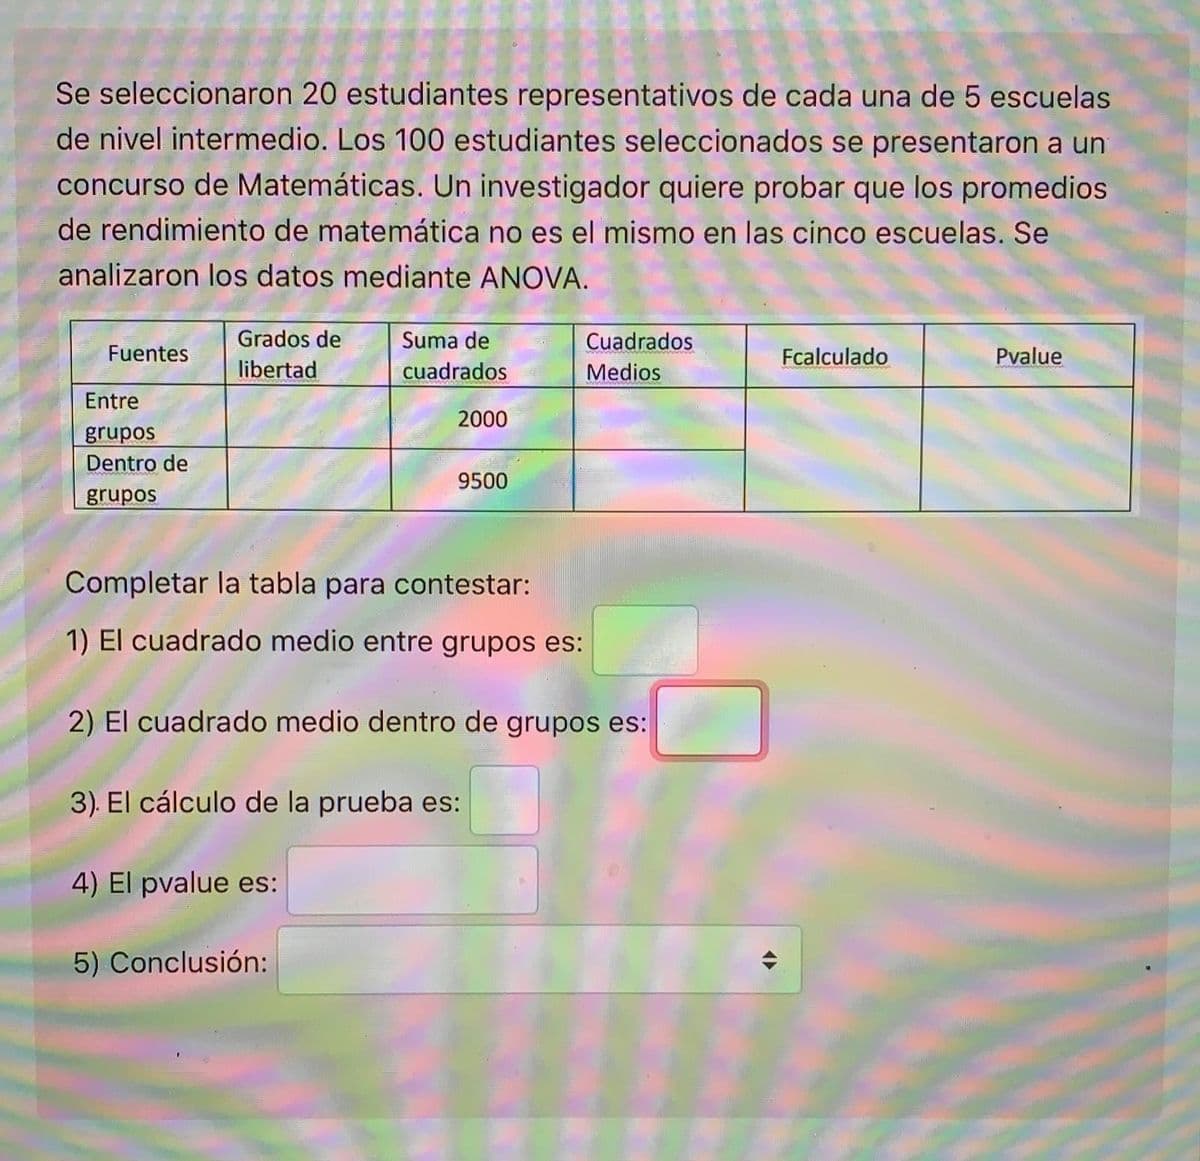
Transcribed Image Text:Se seleccionaron 20 estudiantes representativos de cada una de 5 escuelas
de nivel intermedio. Los 100 estudiantes seleccionados se presentaron a un
concurso de Matemáticas. Un investigador quiere probar que los promedios
de rendimiento de matemática no es el mismo en las cinco escuelas. Se
analizaron los datos mediante ANOVA.
Grados de
Suma de
Cuadrados
Fuentes
Fcalculado
Pvalue
libertad
cuadrados
Medios
Entre
2000
grupos
Dentro de
9500
grupos
Completar la tabla para contestar:
1) El cuadrado medio entre grupos es:
2) El cuadrado medio dentro de grupos es:
3). El cálculo de la prueba es:
4) El pvalue es:
5) Conclusión:
Expert Solution
This question has been solved!
Explore an expertly crafted, step-by-step solution for a thorough understanding of key concepts.

Step by step
Solved in 4 steps

Recommended textbooks for you
MATLAB: An Introduction with Applications
Statistics
ISBN:
9781119256830
Author:
Amos Gilat
Publisher:
John Wiley & Sons Inc

Probability and Statistics for Engineering and th…
Statistics
ISBN:
9781305251809
Author:
Jay L. Devore
Publisher:
Cengage Learning

Statistics for The Behavioral Sciences (MindTap C…
Statistics
ISBN:
9781305504912
Author:
Frederick J Gravetter, Larry B. Wallnau
Publisher:
Cengage Learning
MATLAB: An Introduction with Applications
Statistics
ISBN:
9781119256830
Author:
Amos Gilat
Publisher:
John Wiley & Sons Inc
Probability and Statistics for Engineering and th…
Statistics
ISBN:
9781305251809
Author:
Jay L. Devore
Publisher:
Cengage Learning
Statistics for The Behavioral Sciences (MindTap C…
Statistics
ISBN:
9781305504912
Author:
Frederick J Gravetter, Larry B. Wallnau
Publisher:
Cengage Learning

Elementary Statistics: Picturing the World (7th E…
Statistics
ISBN:
9780134683416
Author:
Ron Larson, Betsy Farber
Publisher:
PEARSON

The Basic Practice of Statistics
Statistics
ISBN:
9781319042578
Author:
David S. Moore, William I. Notz, Michael A. Fligner
Publisher:
W. H. Freeman

Introduction to the Practice of Statistics
Statistics
ISBN:
9781319013387
Author:
David S. Moore, George P. McCabe, Bruce A. Craig
Publisher:
W. H. Freeman