20 The following graph shows the short-run aggregate supply curve (AS), the aggregate demand curve (AD), and the long-run aggregate supply curve (LRAS) for a hypothetical economy. Initially, the expected price level is equal to the actual price level, and the economy is in long-run equilibrium at its natural level of output, $120 billion. Suppose a bout of severe weather drives up agricultural costs, increases the costs of transporting goods and services, and increases the costs of producing goods and services in this economy. Use the graph to help you answer the questions about the short-run and long-run effects of the increase in production costs that follow. (Note: You will not be graded on any adjustments made to the graph.) Hint: For simplicity, ignore any possible impact of the severe weather on the natural level of output. 140 LRAS 135 AS RICE LEVEL 130 125 120 | 2 4 2 4
20 The following graph shows the short-run aggregate supply curve (AS), the aggregate demand curve (AD), and the long-run aggregate supply curve (LRAS) for a hypothetical economy. Initially, the expected price level is equal to the actual price level, and the economy is in long-run equilibrium at its natural level of output, $120 billion. Suppose a bout of severe weather drives up agricultural costs, increases the costs of transporting goods and services, and increases the costs of producing goods and services in this economy. Use the graph to help you answer the questions about the short-run and long-run effects of the increase in production costs that follow. (Note: You will not be graded on any adjustments made to the graph.) Hint: For simplicity, ignore any possible impact of the severe weather on the natural level of output. 140 LRAS 135 AS RICE LEVEL 130 125 120 | 2 4 2 4

Brief Principles of Macroeconomics (MindTap Course List)
8th Edition
ISBN:9781337091985
Author:N. Gregory Mankiw
Publisher:N. Gregory Mankiw
Chapter15: Aggregate Demand And Aggregate Supply
Section: Chapter Questions
Problem 8PA

Related questions
Question
Transcribed Image Text:20
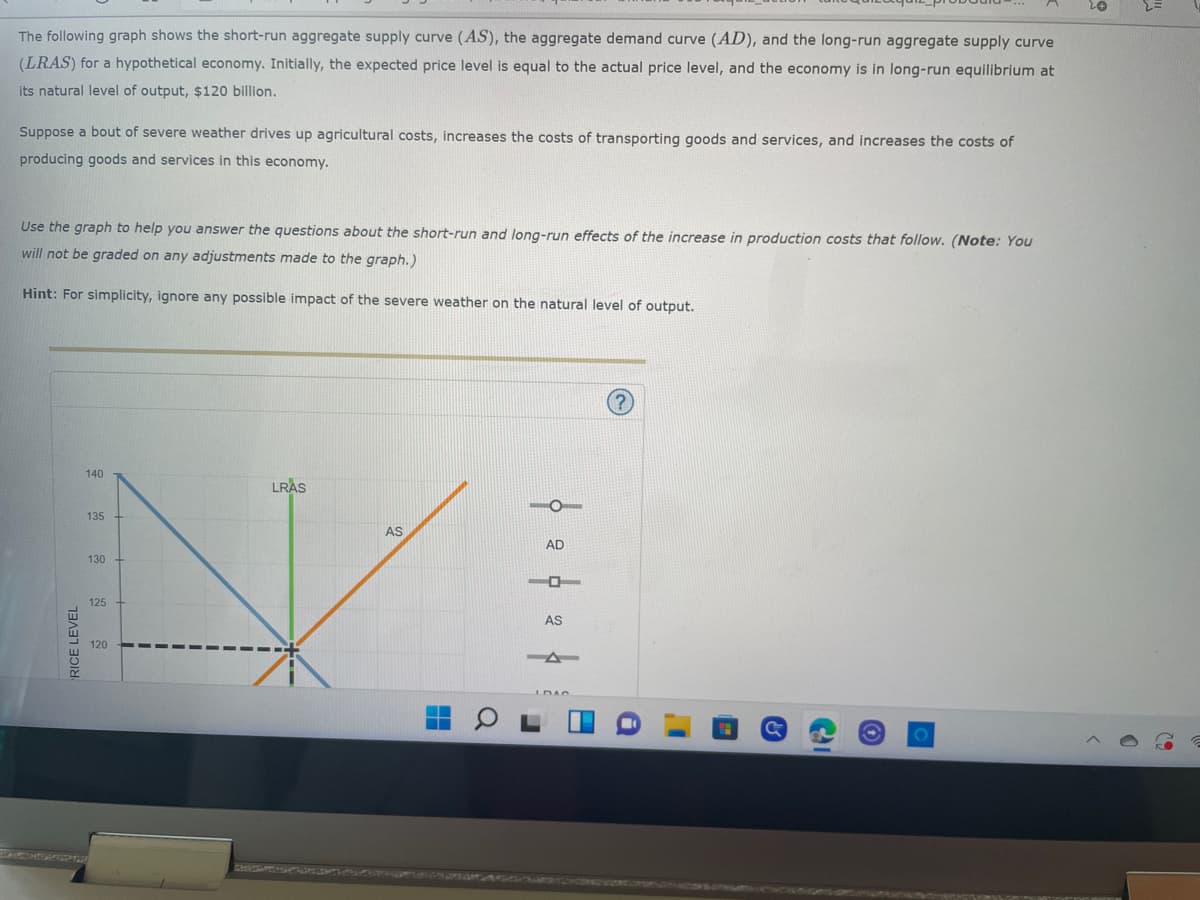
The following graph shows the short-run aggregate supply curve (AS), the aggregate demand curve (AD), and the long-run aggregate supply curve
(LRAS) for a hypothetical economy. Initially, the expected price level is equal to the actual price level, and the economy is in long-run equilibrium at
its natural level of output, $120 billion.
Suppose a bout of severe weather drives up agricultural costs, increases the costs of transporting goods and services, and increases the costs of
producing goods and services in this economy.
Use the graph to help you answer the questions about the short-run and long-run effects of the increase in production costs that follow. (Note: You
will not be graded on any adjustments made to the graph.)
Hint: For simplicity, ignore any possible impact of the severe weather on the natural level of output.
140
LRAS
135
AS
AD
AS
RICE LEVEL
130
125
120
C
Transcribed Image Text:https://apila.apps.hg.cengage.com/at/servlet/quiz?ctx=bkhana-0031&quiz_action=takeQuiz&quiz_probGuid=... A
AS
AD
AS
LRAS
AD
100 105
110
115
120
125
130
135
140
OUTPUT (Billions of dollars)
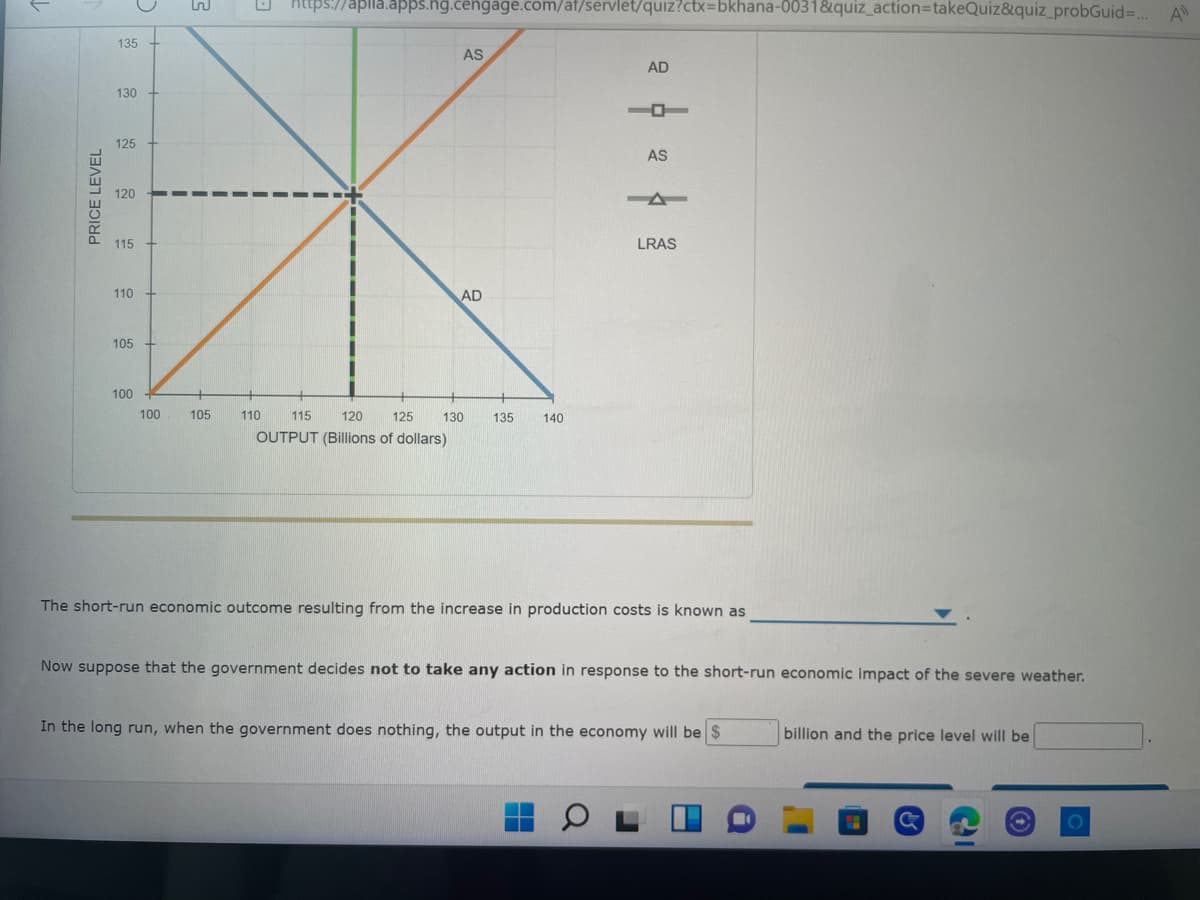
The short-run economic outcome resulting from the increase in production costs is known as
Now suppose that the government decides not to take any action in response to the short-run economic impact of the severe weather.
In the long run, when the government does nothing, the output in the economy will be $
billion and the price level will be
PRICE LEVEL
135
130
125
120
115
110
105
100
2
2
Expert Solution
This question has been solved!
Explore an expertly crafted, step-by-step solution for a thorough understanding of key concepts.

This is a popular solution!

Trending now
This is a popular solution!

Step by step
Solved in 3 steps with 1 images

Knowledge Booster


Learn more about
Need a deep-dive on the concept behind this application? Look no further. Learn more about this topic, economics and related others by exploring similar questions and additional content below.Recommended textbooks for you
Brief Principles of Macroeconomics (MindTap Cours…
Economics
ISBN:
9781337091985
Author:
N. Gregory Mankiw
Publisher:
Cengage Learning

Essentials of Economics (MindTap Course List)
Economics
ISBN:
9781337091992
Author:
N. Gregory Mankiw
Publisher:
Cengage Learning

Macroeconomics: Private and Public Choice (MindTa…
Economics
ISBN:
9781305506756
Author:
James D. Gwartney, Richard L. Stroup, Russell S. Sobel, David A. Macpherson
Publisher:
Cengage Learning
Brief Principles of Macroeconomics (MindTap Cours…
Economics
ISBN:
9781337091985
Author:
N. Gregory Mankiw
Publisher:
Cengage Learning
Essentials of Economics (MindTap Course List)
Economics
ISBN:
9781337091992
Author:
N. Gregory Mankiw
Publisher:
Cengage Learning
Macroeconomics: Private and Public Choice (MindTa…
Economics
ISBN:
9781305506756
Author:
James D. Gwartney, Richard L. Stroup, Russell S. Sobel, David A. Macpherson
Publisher:
Cengage Learning

Economics: Private and Public Choice (MindTap Cou…
Economics
ISBN:
9781305506725
Author:
James D. Gwartney, Richard L. Stroup, Russell S. Sobel, David A. Macpherson
Publisher:
Cengage Learning

Principles of Economics 2e
Economics
ISBN:
9781947172364
Author:
Steven A. Greenlaw; David Shapiro
Publisher:
OpenStax
