200 100 0.5 flyers 1 flyer 25 50 75 100 125 150 175 200 225 250 COLOR FLYERS 2 flyers 6 flyers t the optimum that you indicated on the graph, Shen's marginal rate of substitution is equal to in black and white per flyer in color.
200 100 0.5 flyers 1 flyer 25 50 75 100 125 150 175 200 225 250 COLOR FLYERS 2 flyers 6 flyers t the optimum that you indicated on the graph, Shen's marginal rate of substitution is equal to in black and white per flyer in color.

Chapter3: Preferences And Utility
Section: Chapter Questions
Problem 3.7P

Related questions
Question
Transcribed Image Text:300
3
200
100
0.5 flyers
1 flyer
* 25
50
75
100
125
150
175
200
225
250
COLOR FLYERS
2 flyers
6 flyers
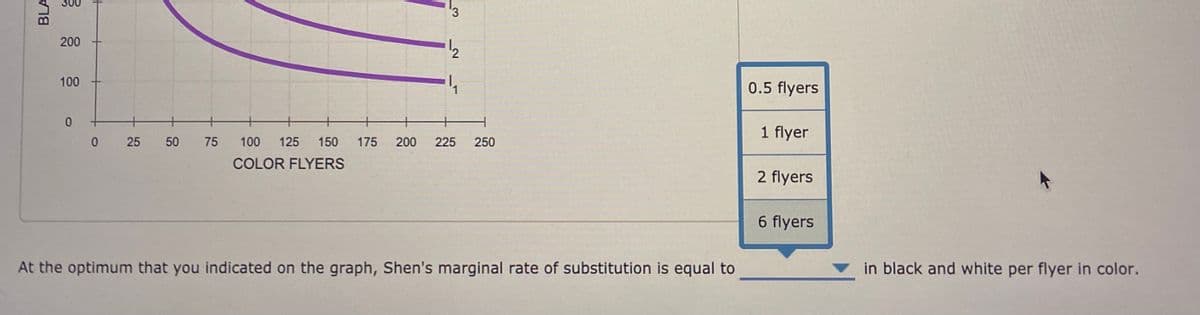
At the optimum that you indicated on the graph, Shen's marginal rate of substitution is equal to
in black and white per flyer in color.
BLA
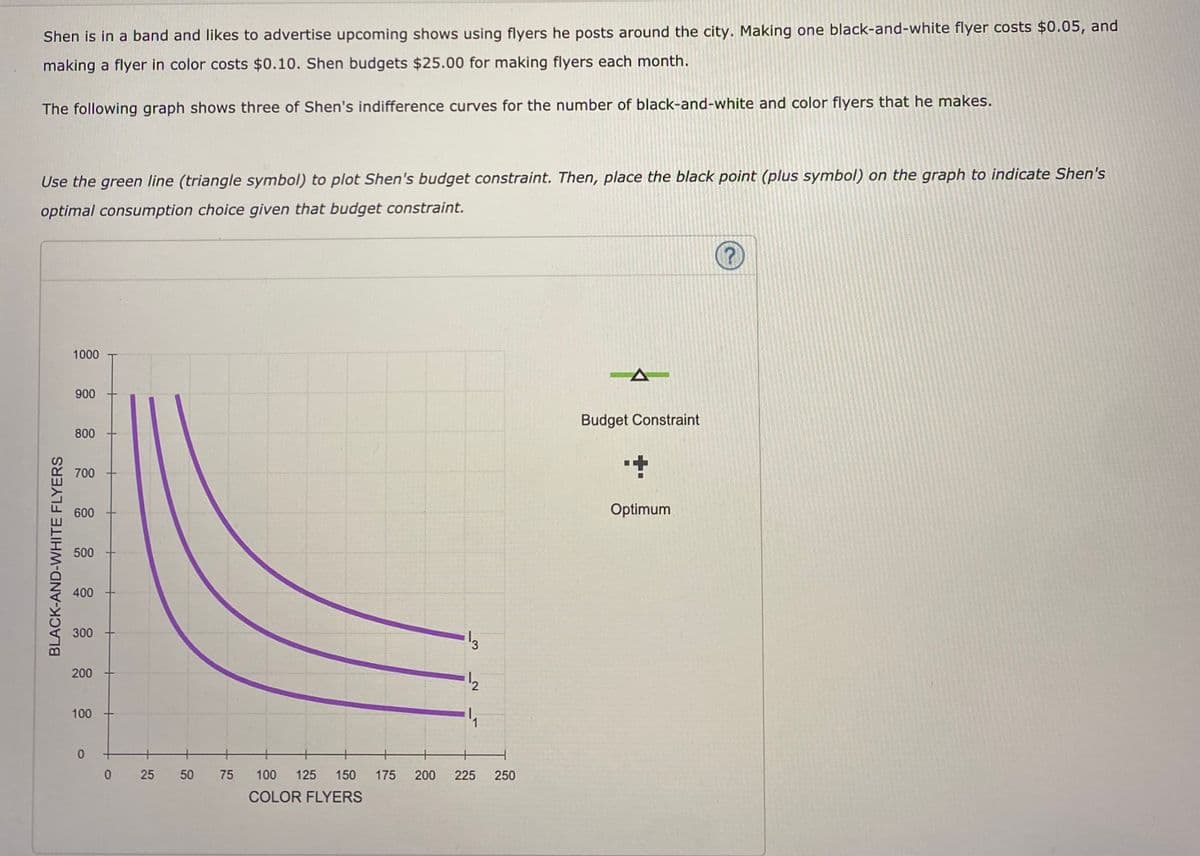
Transcribed Image Text:Shen is in a band and likes to advertise upcoming shows using flyers he posts around the city. Making one black-and-white flyer costs $0.05, and
making a flyer in color costs $0.10. Shen budgets $25.00 for making flyers each month.
The following graph shows three of Shen's indifference curves for the number of black-and-white and color flyers that he makes.
Use the green line (triangle symbol) to plot Shen's budget constraint. Then, place the black point (plus symbol) on the graph to indicate Shen's
optimal consumption choice given that budget constraint.
1000
900
Budget Constraint
800
700
600
Optimum
500
400
300
200
100
0 25 50
75
100
125
150
175
200
225
250
COLOR FLYERS
BLACK-AND-WHITE FLYERS
Expert Solution
This question has been solved!
Explore an expertly crafted, step-by-step solution for a thorough understanding of key concepts.

This is a popular solution!

Trending now
This is a popular solution!

Step by step
Solved in 2 steps with 1 images

Recommended textbooks for you

Exploring Economics
Economics
ISBN:
9781544336329
Author:
Robert L. Sexton
Publisher:
SAGE Publications, Inc

Economics: Private and Public Choice (MindTap Cou…
Economics
ISBN:
9781305506725
Author:
James D. Gwartney, Richard L. Stroup, Russell S. Sobel, David A. Macpherson
Publisher:
Cengage Learning
Exploring Economics
Economics
ISBN:
9781544336329
Author:
Robert L. Sexton
Publisher:
SAGE Publications, Inc
Economics: Private and Public Choice (MindTap Cou…
Economics
ISBN:
9781305506725
Author:
James D. Gwartney, Richard L. Stroup, Russell S. Sobel, David A. Macpherson
Publisher:
Cengage Learning

Microeconomics: Private and Public Choice (MindTa…
Economics
ISBN:
9781305506893
Author:
James D. Gwartney, Richard L. Stroup, Russell S. Sobel, David A. Macpherson
Publisher:
Cengage Learning

