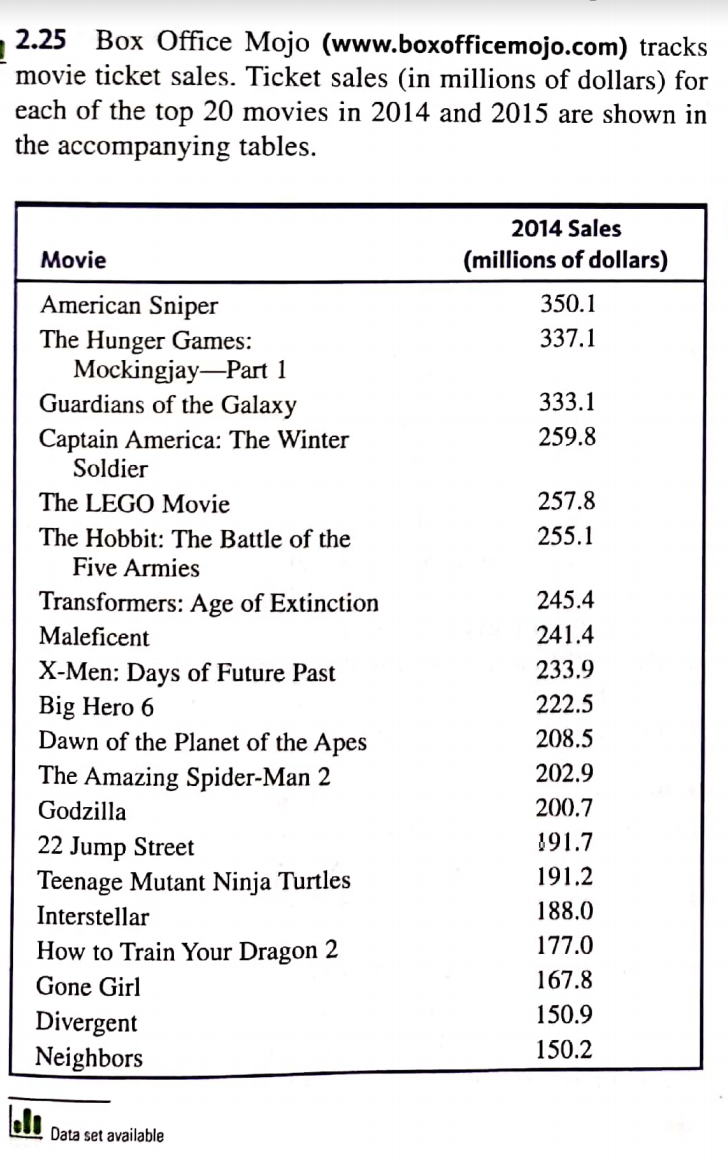
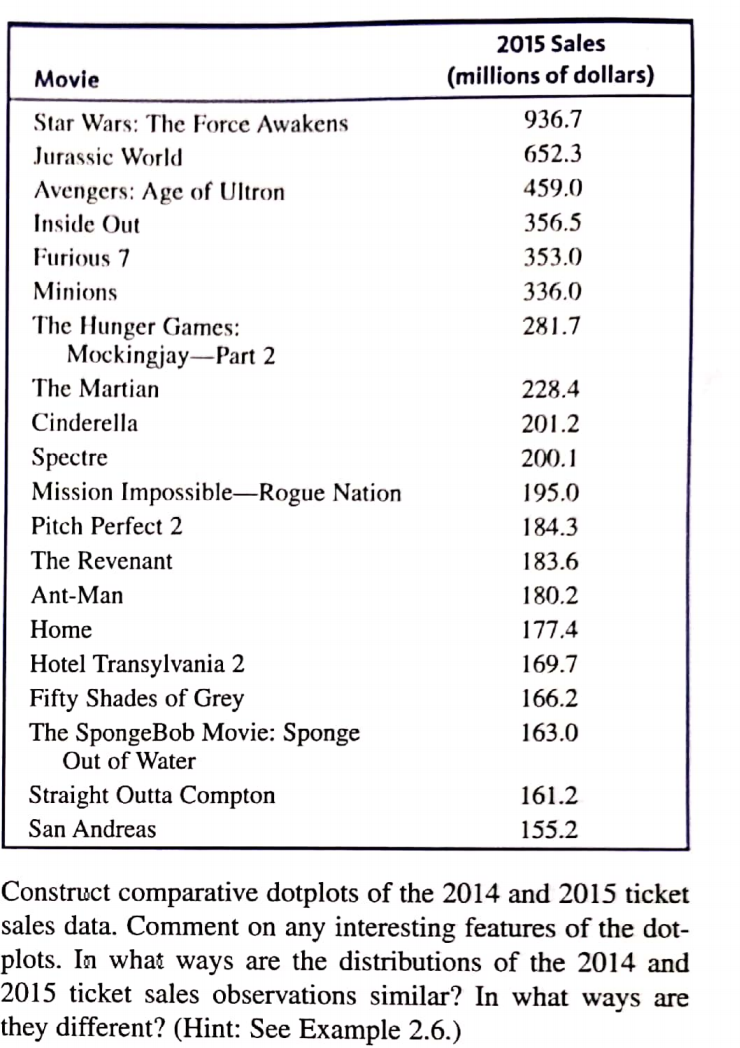
2015 Sales Movie (millions of dollars) Star Wars: The Force Awakens 936.7 Jurassic World 652.3 Avengers: Age of Ultron 459.0 Inside Out 356.5 Furious 7 353.0 Minions 336.0 The Hunger Games: Mockingjay-Part 2 281.7 The Martian 228.4 Cinderella 201.2 Spectre Mission Impossible-Rogue Nation 200.1 195.0 Pitch Perfect 2 184.3 The Revenant 183.6 Ant-Man 180.2 Home 177.4 Hotel Transylvania 2 169.7 Fifty Shades of Grey 166.2 The SpongeBob Movie: Sponge Out of Water 163.0 Straight Outta Compton 161.2 San Andreas 155.2 Construct comparative dotplots of the 2014 and 2015 ticket sales data. Comment on any interesting features of the dot- plots. In what ways are the distributions of the 2014 and 2015 ticket sales observations similar? In what ways are they different? (Hint: See Example 2.6.)


Compound Probability
Compound probability can be defined as the probability of the two events which are independent. It can be defined as the multiplication of the probability of two events that are not dependent.
Tree diagram
Probability theory is a branch of mathematics that deals with the subject of probability. Although there are many different concepts of probability, probability theory expresses the definition mathematically through a series of axioms. Usually, these axioms express probability in terms of a probability space, which assigns a measure with values ranging from 0 to 1 to a set of outcomes known as the sample space. An event is a subset of these outcomes that is described.
Conditional Probability
By definition, the term probability is expressed as a part of mathematics where the chance of an event that may either occur or not is evaluated and expressed in numerical terms. The range of the value within which probability can be expressed is between 0 and 1. The higher the chance of an event occurring, the closer is its value to be 1. If the probability of an event is 1, it means that the event will happen under all considered circumstances. Similarly, if the probability is exactly 0, then no matter the situation, the event will never occur.


Trending now
This is a popular solution!

Step by step
Solved in 3 steps with 1 images


