The accompanying table shows the reasons given by people 16 years of age and older in the United States who are not in the labor force for not working in early 2015. Counts are in thousands of people. Complete parts a through d below E Click the icon to view the survey results. - X Survey results a) What percent of the unemployed population searched, but not in the past 4 weeks? % Age Reason 2 55 1039 (Round to one decimal place as needed ) 16-24 25-54 Total 1337 Did not search for work in the previous year Searched, but not in past 4 weeks Not available to work now Available to work now 1072 3448 2875 b) What percent of the unemployed population searched, but not in the past 4 weeks and were aged 25 to 54 years 969 1332 574 303 284 81 668 666 1048 493 205 2207 739 Discouraged over job prospects Reasons other than discouragement Family responsibilities In school or training III health or disability (Round to one decimal place as needed.) 184 350 482 697 289 1468 c) What percent of the unemployed 25- to 54-year-olds did not search for work in the previous year? 34 160 45 239 208 16 54 4 266 161 84 61 Other 224 398 179 801 (Round to one decimal place as needed Total 4158 5744 2970 12,872 d) What percent of unemployed people were aged 25 to 54 years? (Round to one decimal place as needed. Print Done
The accompanying table shows the reasons given by people 16 years of age and older in the United States who are not in the labor force for not working in early 2015. Counts are in thousands of people. Complete parts a through d below E Click the icon to view the survey results. - X Survey results a) What percent of the unemployed population searched, but not in the past 4 weeks? % Age Reason 2 55 1039 (Round to one decimal place as needed ) 16-24 25-54 Total 1337 Did not search for work in the previous year Searched, but not in past 4 weeks Not available to work now Available to work now 1072 3448 2875 b) What percent of the unemployed population searched, but not in the past 4 weeks and were aged 25 to 54 years 969 1332 574 303 284 81 668 666 1048 493 205 2207 739 Discouraged over job prospects Reasons other than discouragement Family responsibilities In school or training III health or disability (Round to one decimal place as needed.) 184 350 482 697 289 1468 c) What percent of the unemployed 25- to 54-year-olds did not search for work in the previous year? 34 160 45 239 208 16 54 4 266 161 84 61 Other 224 398 179 801 (Round to one decimal place as needed Total 4158 5744 2970 12,872 d) What percent of unemployed people were aged 25 to 54 years? (Round to one decimal place as needed. Print Done

Mathematics For Machine Technology
8th Edition
ISBN:9781337798310
Author:Peterson, John.
Publisher:Peterson, John.
Chapter24: Percent Practical Applications
Section: Chapter Questions
Problem 32A: A manufacturer estimates that 15,500 pieces per day could be produced with the installation of new...

Related questions
Question
Please help me
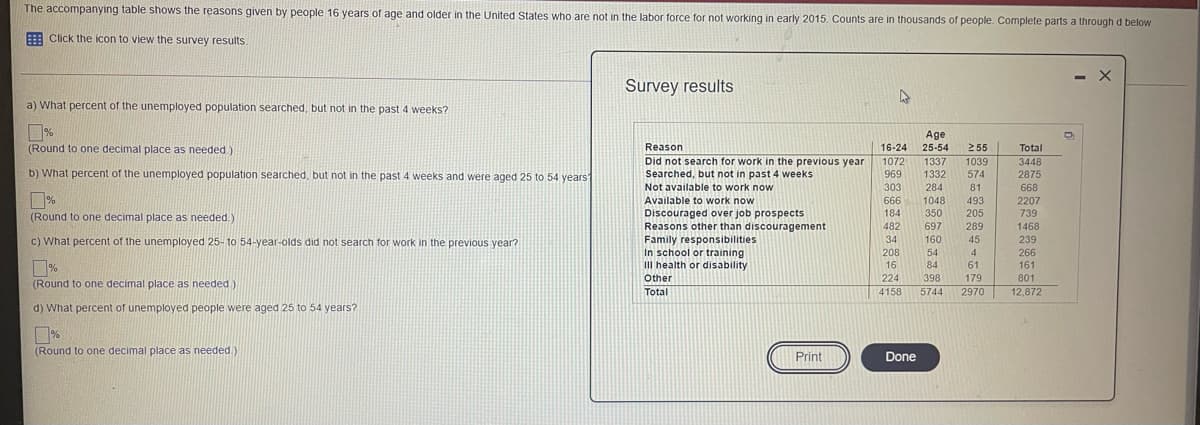
Transcribed Image Text:The accompanying table shows the reasons given by people 16 years of age and older in the United States who are not in the labor force for not working in early 2015. Counts are in thousands of people. Complete parts a through d below
E Click the icon to view the survey results.
- X
Survey results
a) What percent of the unemployed population searched, but not in the past 4 weeks?
D%
(Round to one decimal place as needed )
Age
Reason
16-24
25-54
2 55
Total
1337
Did not search for work in the previous year
Searched, but not in past 4 weeks
Not available to work now
1072
1039
3448
2875
b) What percent of the unemployed population searched, but not in the past 4 weeks and were aged 25 to 54 years
969
1332
574
303
284
81
668
Available to work now
666
1048
493
2207
739
Discouraged over job prospects
Reasons other than discouragement
184
350
205
(Round to one decimal place as needed,)
482
697
289
1468
C) What percent of the unemployed 25- to 54-year-olds did not search for work in the previous year?
34
160
45
Family responsibilities
In school or training
III health or disability
239
266
208
16
54
4
D%
(Round to one decimal place as needed
84
61
161
Other
224
398
179
801
Total
4158
5744
2970
12,872
d) What percent of unemployed people were aged 25 to 54 years?
(Round to one decimal place as needed.)
Print
Done
Expert Solution
This question has been solved!
Explore an expertly crafted, step-by-step solution for a thorough understanding of key concepts.

This is a popular solution!

Trending now
This is a popular solution!

Step by step
Solved in 2 steps with 2 images

Recommended textbooks for you
Mathematics For Machine Technology
Advanced Math
ISBN:
9781337798310
Author:
Peterson, John.
Publisher:
Cengage Learning,

Functions and Change: A Modeling Approach to Coll…
Algebra
ISBN:
9781337111348
Author:
Bruce Crauder, Benny Evans, Alan Noell
Publisher:
Cengage Learning

Mathematics For Machine Technology
Advanced Math
ISBN:
9781337798310
Author:
Peterson, John.
Publisher:
Cengage Learning,
Functions and Change: A Modeling Approach to Coll…
Algebra
ISBN:
9781337111348
Author:
Bruce Crauder, Benny Evans, Alan Noell
Publisher:
Cengage Learning

Holt Mcdougal Larson Pre-algebra: Student Edition…
Algebra
ISBN:
9780547587776
Author:
HOLT MCDOUGAL
Publisher:
HOLT MCDOUGAL

Algebra: Structure And Method, Book 1
Algebra
ISBN:
9780395977224
Author:
Richard G. Brown, Mary P. Dolciani, Robert H. Sorgenfrey, William L. Cole
Publisher:
McDougal Littell