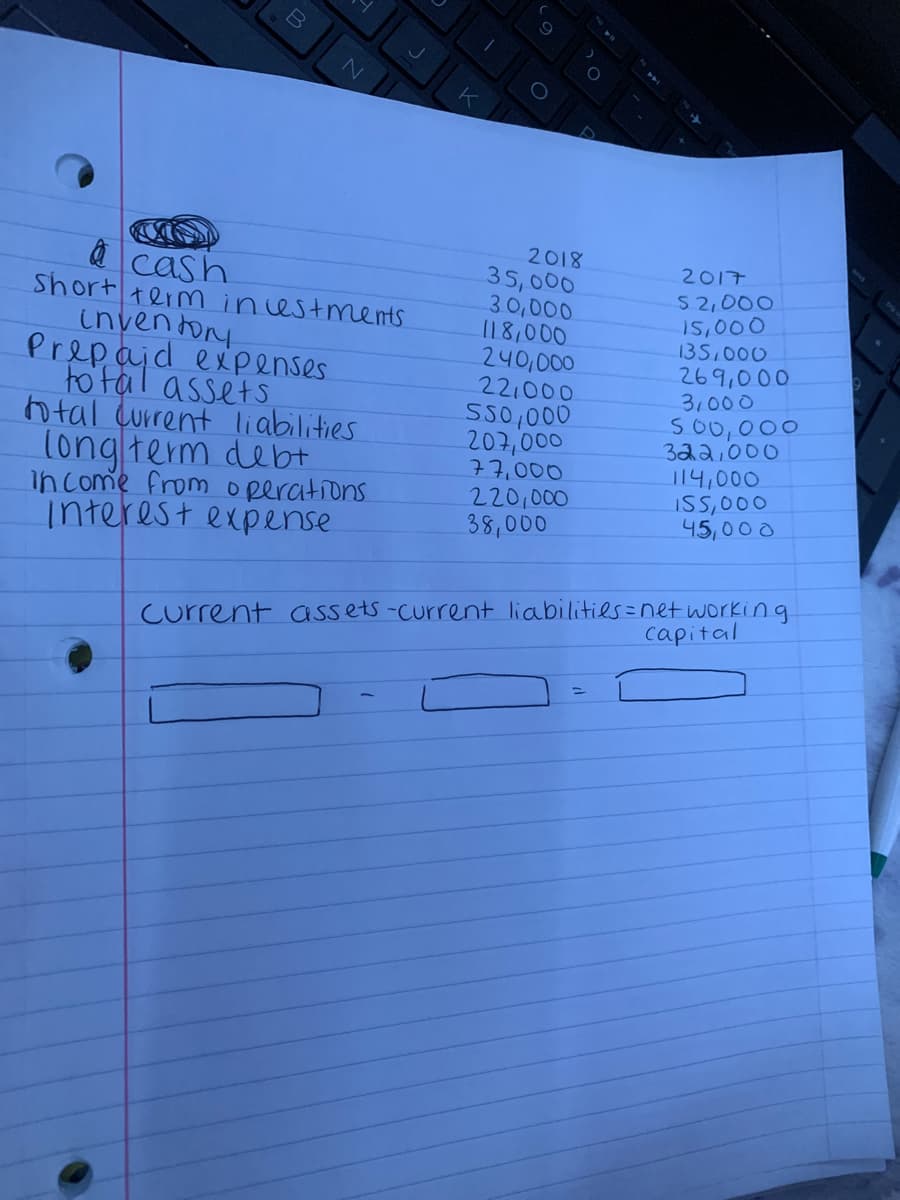
2018 35,000 30,000 118,000 240,000 22,000 SS0,000 207,000 a cash Short 2017 S2,000 15,000 135,000 269,000 3,000 term inestments inven tory Prepaid expenses to tal assets o tal current liabilities longterm debt in come from operations interest expense s00,000 322,000 114,000 ISS,000 45,000 220,000 38,000 Current assets-current liabilitils=net working capital %3D


Q: Inc, published its financial statements for 2020. Assets: 1 000 million Equity: 1 000 million How…
A: Capital structure refers to the mix of source from where the long term funds required in a business…
Q: Balance Sheet 3-Dudes, Inc. Liabilities & Owners' Equity: Assets: 2021 2022 $22,000 $18,000 $26,000…
A: 9.Year 2022Total Liabilities = $361,000Total Assets = $682,000 Calculation of Debt Ratio is as…
Q: 2017 750 Cterory 2016 300 Accounts payable Accounts receivable Accruals Cash 900 825 450 300 1,500…
A: Total Assets= Total Liabilities and Equity Total Liabilities and Equity- Accruals…
Q: The balance sheet of Kangaroo Company as of December 31 is presented below: Assets Cash Marketable…
A: Participating Preference Share: In the case of participating preferred stock, the holder has the…
Q: 2019 2018 2019 2018 Liabilities and Owners' Equity Current labities Assets Current assets 88,509 $…
A: (a).Current Ratio Current ratio = Current assets / Current liabilities Current Ratio 2018= .68 Times…
Q: 4. Net Income in 2021 а. Р124,000 b. P160,000 c. P130,000 d. P140,000 5. Working capital, end of…
A:
Q: Just Dew It Corporation 2018 and 2019 Balance Sheets Assets Liabilities and Owner’s Equity…
A: Formulas used: Debt-Equity ratio = Total Long term debt/Total Owners' equity Equity Multiplier =…
Q: (Ratio Computations and Analysis) Prior Company’s condensed financial statements provide the…
A: Hello, since the student has posted multiple questions, we will answer only requirement (a). Thank…
Q: Just Dew It Corporation 2018 and 2019 Balance Sheets Assets Liabilities and Owner’s Equity…
A: Common size balance sheet shows the ratio(expressed in %) between the individual particulars of a…
Q: Tyson Company's working capital accounts at December 31, 2018, are given below: Current Assets: Cash…
A: a. 1) Working capital => [ Current Assets - Current liability ]…
Q: Balances extracted from the Statement of Financial Position as at 31 December: 2020 2019 R R Plant…
A:
Q: High-Tex Limited Income Statement for the year ending 30 June 2019 ($’000) 2018 ($’000) Revenue -…
A: The given ratios help the firm to assess its profitability, financial performance as well as…
Q: WOBking cap all Yeaxs? ital fox all Years? As Reported Annual Balance Sheet Report Date Scale Assets…
A: Lets understand the basics. Working capital is a capital which is needed to run a day to day…
Q: Balance Sheet 3-Dudes, Inc. Liabilities & Owners' Equity: Assets: 2021 2022 $22,000 $18,000 $26,000…
A: 6.2022Current Assets = $292,000Inventories = $27,000Current Liabilities = $76,000 Calculation of…
Q: 31 December 2020 and 31 December 2021: 2020 (RM) 2021 (RM) ASSETS: Freehold land 477,000 212,000…
A: Statement of cash flow is prepared to see the flow of cash in the company. It serves as cash book…
Q: On December 31, 2020, the statement of fi ollowing data with profit or loss sharing ra Cash…
A: Profit and loss Profit or loss of the company is measured by preparing income statement which shows…
Q: 2019: Profit Margin – Profit $1435 / Net Sales $38,464 = 0.037:1 OR 3.7% Working Capital – Current…
A:
Q: Just Dew It Corporation 2018 and 2019 Balance Sheets Assets Liabilities and Owner’s Equity…
A: Change in account during 2019 is shown below:
Q: Assets Liabilities and Owners' Equity 2020 2021 2020 2021 Current Assets…
A:
Q: Statement of Financial Position For Year Ended December 31, 2020 urrent Assets nventory Current…
A: XYZ COMPANY Statement of Financial Position For the Year Ended December 31, 2020 Assets…
Q: Balance Sheet Accounts (December 31) 2019 2020 Cash 283,000 1,000,000 P 150,000 850,000 P Marketable…
A: Financial statements can be defined as the financial reports for the accounting period that depicts…
Q: Balances extracted from the Statement of Financial Position as at 31 December: 2020 2019 R R Plant…
A: A cash flow statement (CFS) is a financial statement that details the amount of cash and cash…
Q: 2019 2018 Rate of Inc(Dec) Assets: Current assets P550,000.00 45% 21.98% Long-term investments 10%…
A: Balance sheet means where all assets , liabilities and capital is shown. Accounting principles says…
Q: The balance sheet of Kangaroo Company as of December 31 is presented below. Assets Cash Marketable…
A: Book Value Per Share: In the financial world, book value per share (BVPS) is defined as the ratio of…
Q: December 31 2021 2020 Assets Current assets: Cash Accounts receivable $ 273,440 85,400 105,000…
A: The cash flow statement records the cash transactions incurred during period classified as operating…
Q: 13 - ABC Company's selected financial statements items are given as following. Its cash and cash…
A: Formula used:
Q: 1) The financial statements for Barrington Service Company include the following items: 2019…
A: The current ratio is the ratio of current assets and current liabilities.
Q: BT21 Co. provided the following data: 2021 2020 Cash P 350,000 840,000 P150,000 Accounts Receivable,…
A: Cash flows from operating activities: It is a section of Statement of cash flow that explains the…
Q: 2020 $152,000 2019 Cash Accounts Receivable Inventory and supplies nvestments Machines ccumulated…
A: Cashflow statement using the indirect method begins by adjusting the net income with non cash items…
Q: a cash Short term inestmets inven toM Prepaid expenses to tal assets o tal current liabilities…
A: Total Current assets = AR + Cash + short term investment + inventory + prepaid expenses Total…
Q: e)You have given the following extracts of accounts of company ABC Itd Sales Purchases Stock Debtors…
A: Note: It is assumed that sales of both years are credit sales.
Q: Balance Sheets At December 31 2018 2017 2018 2017 Assets: $ 24,640 $ 23,040 32,180 73,125 55,900…
A: Cash Flow Statement is the part of Financial Statement which shows the net increase/decrease in Cash…
Q: 38,410 Less : Drawings 44,650 (22.630) (17.000) 21,410 22,020 |Non-current Liabilities Loan from Jon…
A: Cash flow statement is a statement which is prepared to find out the cash comes in and goes out , by…
Q: Balances extracted from the Statement of Financial Position as at 31 December: 2020 2019 R R Plant…
A:
Q: Delta Oil Company uses the successful-efforts method to accout for oil exploration cost. Delta…
A: Income statement- An income statement assists the company's management and board of directors in…
Q: FREE CASH FLOW Arlington Corporation’s financial statements (dollars and shares are in millions) are…
A: Answer A: Net Operating Working Capital=(Current assets-Excess cash)-(Current liabilities -Notes…
Q: Organization's Name: Sloan Kettering (in ,000's) Fin Statement Field 2016 2015 Benefit Expense Cash…
A: The question is related to Cash Flow Statement. The Cash Flow Statement is a Statement of Cash…
Q: Capital 1 January 2019 350 000 Drawings 20 000 Sales (70% on credit) 950 000 Gross profit 250 000…
A: Ratio analysis is done for analysis and comparison with the industry average Creditors settlement…
Q: Capital 1 January 2019 350 000 Drawings 20 000 Sales (70% on credit) 950 000 Gross profit 250…
A:
Q: s Reported Annual Balance Sheet eport Date 2019 2018 2017 2016 Thousands 399,000 1,179,000 1,706,000…
A: Financial leverage tells about the company’s dependency on borrowings and how it generates its…
Q: Capital 1 January 2019 350 000Drawings 20 000Sales (70% on credit) 950 000Gross profit 250 000Total…
A: Goods or items which are stored by the business either for selling or for further production for…
Q: 6. As of December 31, 2020, V CorporatIon reported the fol Php 240,000 520,000 350,000 3,000,000…
A: Balance Sheet: An accounting statement that indicates the financial status of a company at the year…
Q: Balance Sheet 3-Dudes, Inc. Liabilities & Owners' Equity: Assets: 2021 2022 $22,000 $18,000 $26,000…
A: Cash flow from investing activity gives the details of change in cash flows due to the purchase or…
Q: Just Dew It Corporation 2018 and 2019 Balance Sheets Assets Liabilities and Owner’s Equity…
A: Common base year balance sheet shows the change in particulars' amount from the particulars' amount…
Q: Balance Sheet Data Assets 2019 2018 2017 Liabilities 2019 2018 2017 Cash & C.E. Acct. Rec…
A: Common size analysis is a tool which is used by managers to evaluate the percentage of various…
Q: Moneague Wholesale Ltd. Statement of Financial Position as at Dec. 31, 2019 Assets…
A: i. Working capital is the capital required by a business to run its day-to-day operations. It can be…
Q: Balance Sheet 3-Dudes, Inc. Liabilities & Owners' Equity: Assets: 2021 2022 $22,000 $18,000 $26,000…
A: Calculation of Cash Flow from Operations using excel is as follows:


Trending now
This is a popular solution!

Step by step
Solved in 2 steps


- Use the below information to answer the following questions: 20202021Sales$11,573$12,936Depreciation 1661 1736Cost of goods sold 3979 4707Other Expenses 846 924Interest Expense 776 926Cash 6067 6466Accounts Receivables 8034 9427Short-term Notes Payable 1171 1147Long-term debt 20,320 24,696Net fixed assets 50,888 54,273Accounts Payable 4384 4644Tax rate 26% 34%Inventory 14,283 15,288Payout ratio 33% 30% A. Create the Income Statements for 2020 and 2021 (including dividends paid and retained earnings).UTV Corp. have the following account balances for the year ended December 31, 2020:DEBIT BALANCESAmountCash and cash equivalents400,000Accounts receivable900,000Raw materials560,000Goods in process600,000Finished goods1,400,000Financial assets at FVOCI2,500,000Sinking fund200,000Land1,000,000Building6,000,000Plant and equipment2,400,000Patent800,000Goodwill1,400,000Unrealized loss – FVOCI100,000Prepaid benefit cost20,000Treasury shares at cost250,000TOTAL18,530,000 CREDIT BALANCESAmountBank overdraft100,000Due from an officer50,000Allowance for bad debts40,000Accumulated depreciation – building1,600,000Accumulated depreciation – plant and equipment400,000Notes payable, due June 30, 20211,300,000Notes payable, due June 30, 20222,100,000Accounts payable1,000,000Provision180,000Warranty liabilities80,000Income tax payable120,000Finance lease liability180,000Deferred tax liability280,000Actuarial gain300,000Revaluation surplus360,000Share capital6,000,000Share premium2,000,000Retained…SME Balance Sheet 2021 2020 Assets (in millions) Cash 85.960 56.460 Receivables 89.560 80.670 Inventories 55.750 41.260 Other Current Assets 9.950 6.760 Total Current Assets 241.220 185.150 Net Property, Plant, and Equipment 78.970 68.930 Goodwill and Other Intangible Assets 103.110 104.360 Other Non-Current Assets 6.900 4.200 Total Assets 430.200 362.640 Total Liabilities and Shareholders' Equity Payables 83.240 57.48 Current Debt 2.700 2.64 Total Current Liabilities 85.940 60.120 Long-Term Debt 122.000 119.62 Other Liabilities 21.880 22.58 Total Liabilities 229.820 202.320 Common Stock 200.380 160.32 Total Equity 200.38 160.32 Total Liabilities and Equity 430.200 362.640 INCOME STATEMENT 2021 Total Revenue (M) 488.10…
- SME Balance Sheet 2021 2020 Assets (in millions) Cash 85.960 56.460 Receivables 89.560 80.670 Inventories 55.750 41.260 Other Current Assets 9.950 6.760 Total Current Assets 241.220 185.150 Net Property, Plant, and Equipment 78.970 68.930 Goodwill and Other Intangible Assets 103.110 104.360 Other Non-Current Assets 6.900 4.200 Total Assets 430.200 362.640 Total Liabilities and Shareholders' Equity Payables 83.240 57.48 Current Debt 2.700 2.64 Total Current Liabilities 85.940 60.120 Long-Term Debt 122.000 119.62 Other Liabilities 21.880 22.58 Total Liabilities 229.820 202.320 Common Stock 200.380 160.32 Total Equity 200.38 160.32 Total Liabilities and Equity 430.200 362.640 INCOME STATEMENT 2021 Total Revenue (M) 488.10…SME Balance Sheet 2021 2020 Assets (in millions) Cash 85.960 56.460 Receivables 89.560 80.670 Inventories 55.750 41.260 Other Current Assets 9.950 6.760 Total Current Assets 241.220 185.150 Net Property, Plant, and Equipment 78.970 68.930 Goodwill and Other Intangible Assets 103.110 104.360 Other Non-Current Assets 6.900 4.200 Total Assets 430.200 362.640 Total Liabilities and Shareholders' Equity Payables 83.240 57.48 Current Debt 2.700 2.64 Total Current Liabilities 85.940 60.120 Long-Term Debt 122.000 119.62 Other Liabilities 21.880 22.58 Total Liabilities 229.820 202.320 Common Stock 200.380 160.32 Total Equity 200.38 160.32 Total Liabilities and Equity 430.200 362.640 INCOME STATEMENT 2021 Total Revenue (M) 488.10…SME Balance Sheet 2021 2020 Assets (in millions) Cash 85.960 56.460 Receivables 89.560 80.670 Inventories 55.750 41.260 Other Current Assets 9.950 6.760 Total Current Assets 241.220 185.150 Net Property, Plant, and Equipment 78.970 68.930 Goodwill and Other Intangible Assets 103.110 104.360 Other Non-Current Assets 6.900 4.200 Total Assets 430.200 362.640 Total Liabilities and Shareholders' Equity Payables 83.240 57.48 Current Debt 2.700 2.64 Total Current Liabilities 85.940 60.120 Long-Term Debt 122.000 119.62 Other Liabilities 21.880 22.58 Total Liabilities 229.820 202.320 Common Stock 200.380 160.32 Total Equity 200.38 160.32 Total Liabilities and Equity 430.200 362.640 INCOME STATEMENT 2021 Total Revenue (M) 488.10…
- SME Balance Sheet 2021 2020 Assets (in millions) Cash 85.960 56.460 Receivables 89.560 80.670 Inventories 55.750 41.260 Other Current Assets 9.950 6.760 Total Current Assets 241.220 185.150 Net Property, Plant, and Equipment 78.970 68.930 Goodwill and Other Intangible Assets 103.110 104.360 Other Non-Current Assets 6.900 4.200 Total Assets 430.200 362.640 Total Liabilities and Shareholders' Equity Payables 83.240 57.48 Current Debt 2.700 2.64 Total Current Liabilities 85.940 60.120 Long-Term Debt 122.000 119.62 Other Liabilities 21.880 22.58 Total Liabilities 229.820 202.320 Common Stock 200.380 160.32 Total Equity 200.38 160.32 Total Liabilities and Equity 430.200 362.640 INCOME STATEMENT 2021 Total Revenue (M) 488.10…SME Balance Sheet 2021 2020 Assets (in millions) Cash 85.960 56.460 Receivables 89.560 80.670 Inventories 55.750 41.260 Other Current Assets 9.950 6.760 Total Current Assets 241.220 185.150 Net Property, Plant, and Equipment 78.970 68.930 Goodwill and Other Intangible Assets 103.110 104.360 Other Non-Current Assets 6.900 4.200 Total Assets 430.200 362.640 Total Liabilities and Shareholders' Equity Payables 83.240 57.48 Current Debt 2.700 2.64 Total Current Liabilities 85.940 60.120 Long-Term Debt 122.000 119.62 Other Liabilities 21.880 22.58 Total Liabilities 229.820 202.320 Common Stock 200.380 160.32 Total Equity 200.38 160.32 Total Liabilities and Equity 430.200 362.640 INCOME STATEMENT 2021 Total Revenue (M) 488.10…SME Balance Sheet 2021 2020 Assets (in millions) Cash 85.960 56.460 Receivables 89.560 80.670 Inventories 55.750 41.260 Other Current Assets 9.950 6.760 Total Current Assets 241.220 185.150 Net Property, Plant, and Equipment 78.970 68.930 Goodwill and Other Intangible Assets 103.110 104.360 Other Non-Current Assets 6.900 4.200 Total Assets 430.200 362.640 Total Liabilities and Shareholders' Equity Payables 83.240 57.48 Current Debt 2.700 2.64 Total Current Liabilities 85.940 60.120 Long-Term Debt 122.000 119.62 Other Liabilities 21.880 22.58 Total Liabilities 229.820 202.320 Common Stock 200.380 160.32 Total Equity 200.38 160.32 Total Liabilities and Equity 430.200 362.640 INCOME STATEMENT 2021 Total Revenue (M) 488.10…
- SME Balance Sheet 2021 2020 Assets (in millions) Cash 85.960 56.460 Receivables 89.560 80.670 Inventories 55.750 41.260 Other Current Assets 9.950 6.760 Total Current Assets 241.220 185.150 Net Property, Plant, and Equipment 78.970 68.930 Goodwill and Other Intangible Assets 103.110 104.360 Other Non-Current Assets 6.900 4.200 Total Assets 430.200 362.640 Total Liabilities and Shareholders' Equity Payables 83.240 57.48 Current Debt 2.700 2.64 Total Current Liabilities 85.940 60.120 Long-Term Debt 122.000 119.62 Other Liabilities 21.880 22.58 Total Liabilities 229.820 202.320 Common Stock 200.380 160.32 Total Equity 200.38 160.32 Total Liabilities and Equity 430.200 362.640 INCOME STATEMENT 2021 Total Revenue (M) 488.10…SydMel Ltd Statement of financial position As of 30 June 2020. 2020 2019 Assets Cash at Bank 18000 - Account Receivable 34000 28000 Inventories 112000 96000 Land 40000 80000 Buildings 120000 120000 Accumulated depreciation-Buildings (10000) (6000) Equipment 72000 60000 Accumulated depreciation-Equipment (30000) (18000) Total assets 356000 360500 Liabilities Account Payables 52000 48000 Bank Overdraft - 20000 Equity Share Capital 214000 200000 Retained Earnings 90000 92500 Total liabilities and equity 356000 360500 SydMel Ltd Statement of profit and loss and other comprehensive income For the year ended 30 June 2020. 2020 income $ $ Sales revenue - 445500 Less: expenses Cost of sales 288000 Employee expenses 78000 Interest expenses 5000 Loss on…SydMel Ltd Statement of financial position As of 30 June 2020. 2020 2019 Assets Cash at Bank 18000 - Account Receivable 34000 28000 Inventories 112000 96000 Land 40000 80000 Buildings 120000 120000 Accumulated depreciation-Buildings (10000) (6000) Equipment 72000 60000 Accumulated depreciation-Equipment (30000) (18000) Total assets 356000 360500 Liabilities Account Payables 52000 48000 Bank Overdraft - 20000 Equity Share Capital 214000 200000 Retained Earnings 90000 92500 Total liabilities and equity 356000 360500 SydMel Ltd Statement of profit and loss and other comprehensive income For the year ended 30 June 2020. 2020 income $ $ Sales revenue - 445500 Less: expenses Cost of sales 288000 Employee expenses 78000 Interest expenses 5000 Loss on…