22. A recent college graduate is in the process of deciding which one of three graduate the Graduate Management Admission Test (GMAT) scores of those who are accepted GMAT scores. Assume that the data are normally distributed. GMAT Scores School 2 School 1 650 620 630 580 710 690 505 550 700 630 600 650 School 3 590 510 520 500 490 530 a) Set up the ANOVA Table. Use a -0.10 to determine the critical value. b) Can he infer at the 10% significance level that the GMAT scores differ among the three schools? c) Use Fisher's LSD method with a 0.05 to determine which population means differ. d) Use Tukey's method with a -0.05 to determine which population means differ.
22. A recent college graduate is in the process of deciding which one of three graduate the Graduate Management Admission Test (GMAT) scores of those who are accepted GMAT scores. Assume that the data are normally distributed. GMAT Scores School 2 School 1 650 620 630 580 710 690 505 550 700 630 600 650 School 3 590 510 520 500 490 530 a) Set up the ANOVA Table. Use a -0.10 to determine the critical value. b) Can he infer at the 10% significance level that the GMAT scores differ among the three schools? c) Use Fisher's LSD method with a 0.05 to determine which population means differ. d) Use Tukey's method with a -0.05 to determine which population means differ.

Holt Mcdougal Larson Pre-algebra: Student Edition 2012
1st Edition
ISBN:9780547587776
Author:HOLT MCDOUGAL
Publisher:HOLT MCDOUGAL
Chapter11: Data Analysis And Probability
Section: Chapter Questions
Problem 8CR

Related questions
Question
Transcribed Image Text:8:14 1
Done
ED
←
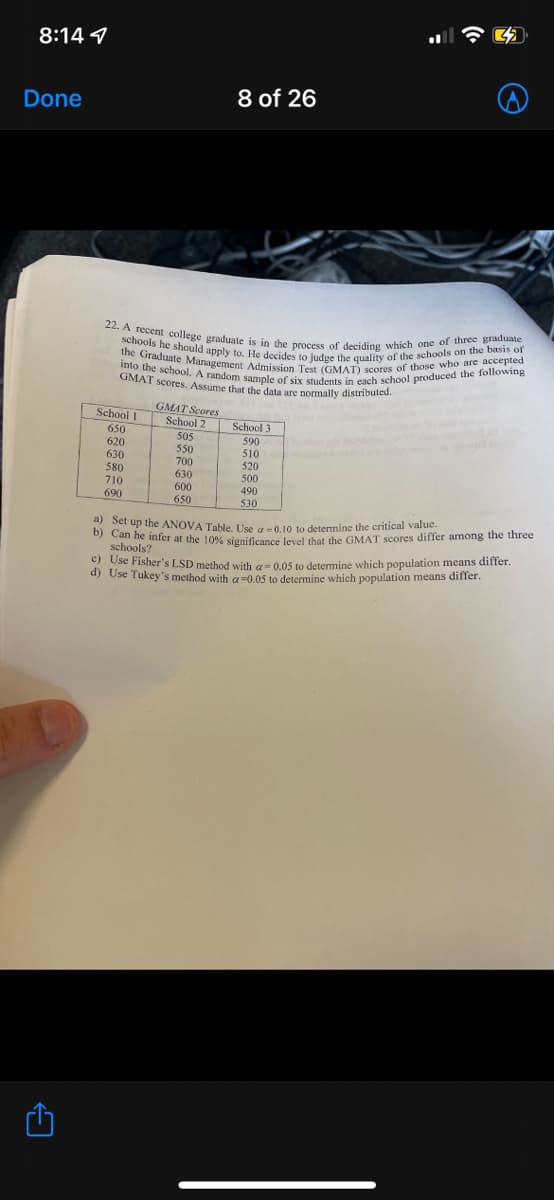
22. A recent college graduate is in the process of deciding which one of three graduate
schools he should apply to. He decides to judge the quality of the schools on the basis of
into the school. A random sample of six students in each school produced the following
the Graduate Management Admission Test (GMAT) scores of those who are accepted
GMAT scores. Assume that the data are normally distributed.
School I
650
620
630
580
710
690
GMAT Scores
School 2
505
550
700
630
8 of 26
600
650
School 3
590
510
520
500
490
530
a) Set up the ANOVA Table. Use a -0,10 to determine the critical value.
b) Can he infer at the 10% significance level that the GMAT scores differ among the three
schools?
C) Use Fisher's LSD method with a = 0.05 to determine which population means differ.
d) Use Tukey's method with a=0.05 to determine which population means differ.
Expert Solution
This question has been solved!
Explore an expertly crafted, step-by-step solution for a thorough understanding of key concepts.

Step by step
Solved in 2 steps with 1 images

Recommended textbooks for you
Holt Mcdougal Larson Pre-algebra: Student Edition…
Algebra
ISBN:
9780547587776
Author:
HOLT MCDOUGAL
Publisher:
HOLT MCDOUGAL

Algebra & Trigonometry with Analytic Geometry
Algebra
ISBN:
9781133382119
Author:
Swokowski
Publisher:
Cengage
Holt Mcdougal Larson Pre-algebra: Student Edition…
Algebra
ISBN:
9780547587776
Author:
HOLT MCDOUGAL
Publisher:
HOLT MCDOUGAL
Algebra & Trigonometry with Analytic Geometry
Algebra
ISBN:
9781133382119
Author:
Swokowski
Publisher:
Cengage